Data Handling – Complete Guide For Class 2 Math Chapter 11
Welcome to iPrep, your Learning Super App. Our learning resources for the chapter, “Data Handling” in Mathematics for Class 2nd are designed to ensure that you grasp this concept with clarity and perfection. Whether you’re studying for an upcoming exam or strengthening your concepts, our engaging animated videos, practice questions and notes offer you the best of integrated learning with interesting explanations and examples.
“Data Handling,” where we will learn how to collect, organize, and understand information or data. Data is all around us whether it’s counting how many apples we have or figuring out how many students like a certain color. In this chapter – Data Handling, you will explore how to handle data by making pictures, marks, and simple charts. By the end of this lesson, you will be able to organize information clearly and use it to answer questions.
Let’s begin our journey into the fun world of data handling!
What is Data Handling?
Data is simply information that we collect. It can be numbers, names, or objects. When you count how many toys you have or how many friends you like in a certain game, that’s data. We can collect data about anything that interests us. The management of that data is called data handling.
Example:
Let’s collect some data. Ask the students, “What is your favorite fruit?” Some may say apple, some may say banana, and others might say mango. The names of the fruits and how many students like each fruit are data.
Activity: Fruit Data Collection
Ask the class to name their favorite fruit. Make a list on the board and count how many students like each fruit. For example, 5 students like apples, 3 like bananas, and 7 like mangoes. This is our data, and we will learn how to organize it in the next section.

Organizing Data
Once we collect data, we need to organize it so we can understand it better. One way to organize data is by making tally marks. Tally marks are simple lines we draw to count things.
Example:
Let’s use the fruit example from earlier. We can organize the data using tally marks.
- Apples: ||||
- Bananas: |||
- Mangoes: |||||
For every 5 students, we draw a group of 4 vertical lines and 1 diagonal line across them. This makes counting easier, especially when the numbers get bigger.
Activity: Tally Marks
Give students a simple survey to do in the classroom. Ask questions like:
- How many students have pets?
- How many students have a bicycle? Then, ask the students to use tally marks to count the answers. This will help them practice organizing data clearly.
Representing Data with Pictures (Pictographs)
Another fun way to organize data is by making pictographs. A pictograph uses pictures or symbols to represent data. For example, if we are counting how many students like different fruits, we can draw pictures of the fruits instead of just writing the numbers.
Example:
Let’s say 4 students like apples, 3 students like bananas, and 6 students like mangoes. We can use pictures to show this data. For example, each picture of an apple can represent 1 student.
- 🍎 🍎 🍎 🍎 (Apples: 4 students)
- 🍌 🍌 🍌 (Bananas: 3 students)
- 🥭 🥭 🥭 🥭 🥭 🥭 (Mangoes: 6 students)
By looking at the pictures, it’s easy to see which fruit is the most popular.
Activity: Creating a Pictograph
Give students a set of data, such as how many students like different types of pets (dogs, cats, fish). Ask them to draw pictures of the pets to represent the number of students. For example, they can draw a picture of a dog for every student who likes dogs. This will help them understand how data can be represented visually.
Drawing Simple Bar Graphs
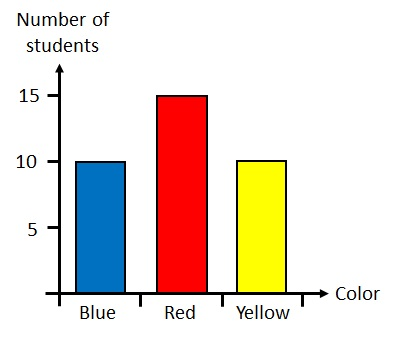
Bar graphs are another way to represent data. A bar graph shows data using bars of different heights. The taller the bar, the bigger the number. Bar graphs are very useful because they let us compare data quickly.
Example:
Let’s say you have data about how many students like different games:
- Cricket: 8 students
- Football: 5 students
- Badminton: 4 students
You can draw a bar graph with these numbers. On one side of the graph, write the names of the games. On the other side, write the numbers. Then, draw bars for each game, with the height of the bar representing how many students like that game.
- Cricket: A tall bar that goes up to 8.
- Football: A bar that goes up to 5.
- Badminton: A shorter bar that goes up to 4.
By looking at the graph, we can quickly see that more students like cricket than football or badminton.
Activity: Bar Graph Creation
Give students a data set, such as how many students like different colors (red, blue, green, yellow). Ask them to draw a simple bar graph. This will help them practice representing data visually and comparing different pieces of data.

Interpreting Data
Once we have organized data in tally marks, pictographs, or bar graphs, we need to interpret it. This means looking at the data and answering questions about it.
Example:
Let’s look at our bar graph of favorite games. If the cricket bar is the tallest, we can say, “Cricket is the most popular game in our class.” If the badminton bar is the shortest, we can say, “Badminton is the least popular game.”
Activity: Answering Questions from a Bar Graph
Give students a bar graph and ask them questions like:
- Which game is the most popular?
- Which game is the least popular?
- How many students like football? This activity will help them learn how to interpret data and draw conclusions from it.
Comparing Data
Sometimes, we need to compare data to understand it better. For example, we can compare how many students like one thing compared to another. Comparing data helps us see patterns and make decisions.
Example:
Let’s say we have data on how many students like different fruits:
- Apples: 5 students
- Bananas: 3 students
- Mangoes: 7 students
We can compare the data and say, “More students like mangoes than apples or bananas.” This helps us understand which fruit is the most popular and which is the least popular.
Activity: Data Comparison
Give students two sets of data and ask them to compare them. For example, you can give them data on how many students like ice cream and how many like cake. Ask them to compare the numbers and tell which is more popular. This activity will help them understand how to compare data.
Let’s Conclude
In this chapter on Data Handling for Class 2nd, we explored exciting ways to collect, organize, and interpret information. Through engaging activities and examples, you learned how to use tally marks, pictographs, and bar graphs to represent data visually. Remember, Data Handling is not just about numbers; it’s about making sense of the information around us.
By practicing the skills you’ve gained in this chapter – Data Handling, you’ll be better equipped to handle data in your everyday life. Whether it’s organizing your toys or understanding your friends’ favorite fruits, mastering Data Handling will help you draw meaningful conclusions. Keep practicing, and soon you’ll be a pro at gathering and organizing data in no time!
So, let’s continue our journey with Data Handling and explore more ways to make learning fun and informative!
Practice questions on Chapter 11 - Data Handling
Get your free Chapter 11 - Data Handling practice quiz of 20+ questions & detailed solutions
Practice Now


