Smart Charts – Complete Guide For Class 5 Math Chapter 12
Welcome to iPrep, your Learning Super App. Our learning resources for the chapter, Smart Charts in Mathematics for Class 5th are designed to ensure that you grasp this concept with clarity and perfection. Whether you’re studying for an upcoming exam or strengthening your concepts, our engaging animated videos, practice questions and notes offer you the best of integrated learning with interesting explanations and examples.
The chapter Smart Charts introduces the concept of organizing and representing data visually. This chapter emphasizes how information can be displayed in different formats such as pictographs, bar graphs, and tally charts to make it easier to understand and analyze. Through real-life examples like counting vehicles on the road or tracking the growth of a plant, students learn how to collect, sort, and present data systematically. The chapter also highlights the importance of interpreting charts and graphs to draw meaningful conclusions. By the end of the chapter, students will have a strong foundation in creating and reading different types of charts, an essential skill for understanding data in everyday life.
Smart Charts
In the chapter “Smart Charts,” students are introduced to data collection, organization, and representation through engaging and practical examples.
Learning with Tally Marks
One of the first concepts introduced in Smart Charts is the use of tally marks to record data.
For example, Yamini surveys her classmates to find out their favorite pet animals.
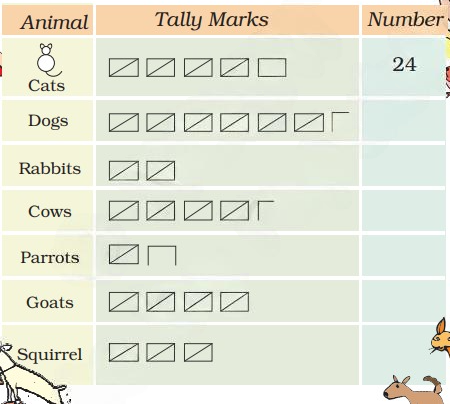
By using Tally marks, she records responses quickly and visually.
Students are encouraged to make their own tally charts by observing daily activities such as counting vehicles or identifying types of trees in their surroundings.
Activity: Tally Marks on the Road
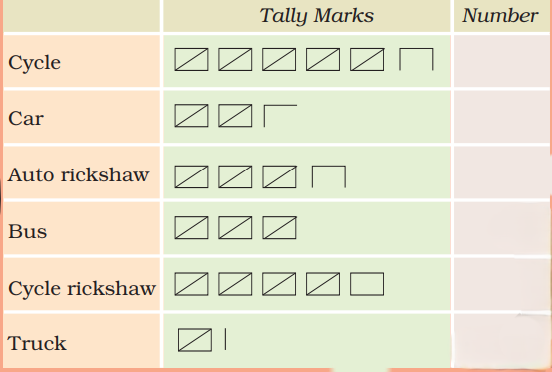
Objective:
To help students understand how to quickly count and group objects using tally marks.
Materials Needed:
- Notebook and pencil for making tally marks.
- A timer or clock to measure time
Learning:
Tally marks are a quick way of recording and counting numbers in groups of five. It is especially useful when counting fast-moving objects like vehicles.
Steps:
- Find a spot near a road or an open space where there is movement of vehicles or people.
- Set a timer for 30 minutes. During this time, students will stand and observe the number of vehicles or objects passing by. Each student will record these in tally marks on their sheet of paper. For every group of 5, they will cross a set of four vertical lines.
- After the timer ends, students will count the number of tally marks they have made. They will then add up the total number of vehicles that pass by.
Discussion:
- How many vehicles passed by in total?
- How did using tally marks help count more quickly?
- In what other situations could tally marks be helpful?
Conclusion:
By using tally marks, students will better understand how to record fast-moving objects in real time and group them for quick counting.
Helping Hands Activity
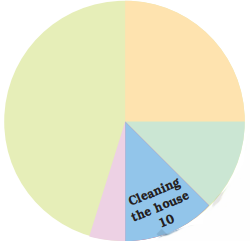
Through various engaging activities given in the chapter Smart Charts, like the “Helping Hands” chart, students understand how data can be grouped based on tasks such as washing utensils, cleaning the house, or cooking.
This activity encourages students to represent their findings using charts, giving them a hands-on approach to understanding group behavior and the importance of organized data.
We can prepare and organize the data this way:
Making, and serving food Number of children Going to the market 40 Washing utensils 20 Making, serving food 15 Cleaning the house 6 Total children who said they help their parents
We can also represent the data in the form of a Pictograph.
Bar Graphs and Data Interpretation
Students also learn to represent information using bar graphs in the chapter Smart Charts. For example, Ragini watches advertisements during TV breaks and counts how many feature children. This helps students visualize comparisons between different categories or observations. The use of bar charts also helps in learning how to analyze data, identify trends, and make simple inferences.
Hot and Cold – Temperature and Climate Comparisons
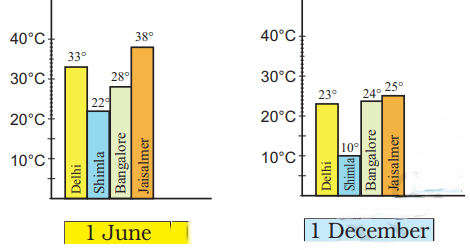
The chapter Smart Charts further delves into using charts to compare weather patterns across different cities. By looking at bar charts, students compare the temperatures of cities like Delhi, Shimla, and Jaisalmer.
This practical activity provides insights into interpreting real-world data and understanding how geography affects climate variations.
Activity:
We often watch weather reports on TV, which provide daily updates on the highest and lowest temperatures in various cities. To keep track of this data, we can organize it and represent it visually using bar charts.
For Example:
These are two bar charts. These show the highest temperature (in degrees Celsius) in four cities, on two different days. The cities are Delhi, Shimla, Bangalore and Jaisalmer.
Rabbits and Family Trees
In another fascinating example, the chapter Smart Charts shows how the rabbit population in Australia rapidly increased over time.
Students learn to track changes year by year, enhancing their understanding of patterns and trends in growth rates.
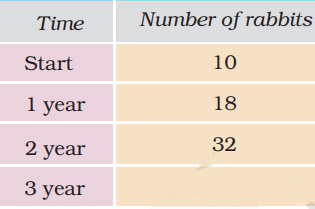
Similarly, the family tree example teaches students about generations and relationships, encouraging them to apply these concepts to their own families.
For Example:
Madhav attended a wedding with his parents and met many relatives, including his mother’s grandfather, but her grandmother had passed away. He also learned that his great-great-grandmother was still alive and over 100 years old. Confused by all the family connections, his mother helped him understand by making a family tree.
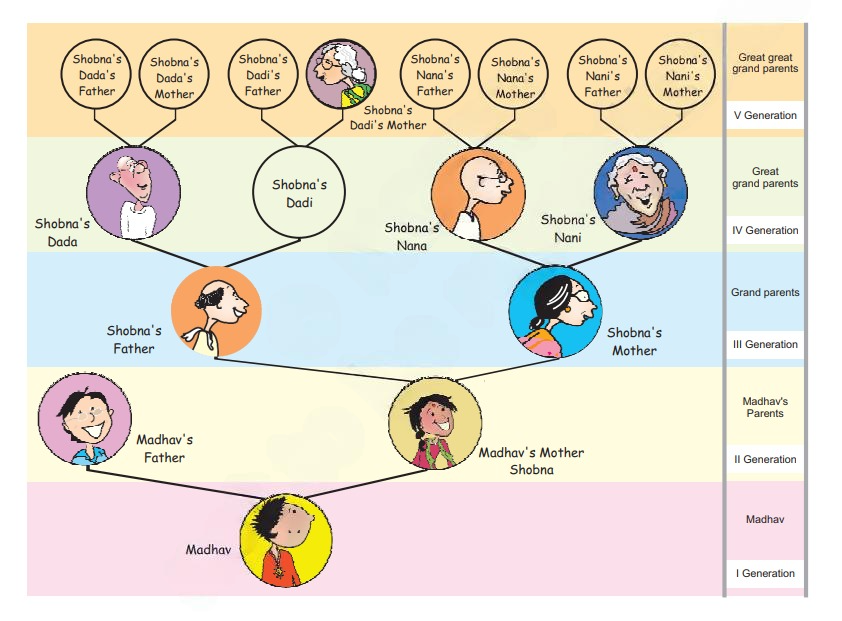
Madhav’s mother helped him understand her family with the help of a Family tree. You can also find out about your older generations using such a family tree.
Growth Charts of Plants – Activity
The chapter Smart Charts wraps up with students observing the growth of a plant, tracking its height over several days, and plotting the data on a graph.
This activity is a fun way to illustrate how data changes over time and helps students predict future outcomes based on current trends.
For Example, Amit planted seeds and measured the plant’s height every four days. The plant grew to 1.4 cm in the first four days and then started growing faster. He marked the height on a chart after each measurement. To check if his markings are correct, compare the dots on the chart with the table showing the height in cm for each day.
Day Length of the plant (in cm) 0 0 5 1.5 10 6.5 15 9.0 20 10 25 10.5
Based on the information in the table, we can plot a graph to represent the plant’s growth.
Let’s Conclude
In conclusion, CBSE Class 5th Math Chapter 12 – Smart Charts provides students with a comprehensive understanding of data collection, organization, and representation. Through engaging activities like tally marks, bar graphs, and pictographs, students learn how to interpret real-world data in a visual format. Smart Charts for Class 5th equips students with the ability to analyze trends, make comparisons, and draw meaningful conclusions from the data they observe in everyday life.
By mastering the concepts taught in CBSE Class 5th Math Chapter 12 – Smart Charts, students develop critical skills that will aid them in both their academic and daily lives. From counting vehicles on the road to tracking plant growth, these interactive lessons ensure that students can confidently apply their knowledge to real-life situations. As they move forward, students will carry these important skills from Class 5th Math Chapter 12 – Smart Charts into more advanced mathematical and analytical tasks.
Practice questions on Chapter 12 - Smart Charts
Get your free Chapter 12 - Smart Charts practice quiz of 20+ questions & detailed solutions
Practice Now


