Tissues – Complete Guide For Class 9 Science Chapter 6

Welcome to iPrep, your Learning Super App. Our learning resources for the chapter,  Tissues Class 9th chapter 5 are designed to ensure that you grasp this concept with clarity and perfection. Whether you’re studying for an upcoming exam or strengthening your concepts, our engaging animated videos, practice questions and notes offer you the best of integrated learning with interesting explanations and examples.

The concept of “Tissues” in Class 9 explores the basic building blocks of all living organisms, delving into how cells group together to form complex structures with specialized functions. This chapter elucidates how tissues are not just isolated entities but integral components that collaborate to sustain life. By examining the diverse types of tissues in plants and animals-ranging from the protective epithelial layers and supportive connective tissues in animals to the water-transporting xylem and nutrient-conducting phloem in plants, students gain a deeper appreciation of how these building blocks contribute to the organism’s overall functionality.

Understanding tissues is pivotal for grasping how different parts of an organism work in harmony, which is essential for studying everything from cellular processes to ecological interactions. This foundational knowledge lays the groundwork for more advanced studies in biology, highlighting the intricate organization and interdependence of life at the tissue level.

What Are Tissues?

In biological terms, tissues are groups of cells that work together to perform a specific function. Each tissue type has a unique structure and role within an organism, contributing to the overall health and functionality of the living being.

Types of Tissues in Animals

Animal tissues are classified into four main types:

  1. Epithelial Tissue: This tissue covers the body surfaces and lines cavities and organs. It acts as a protective barrier and is involved in absorption, secretion, and sensation.
  2. Connective Tissue: Connective tissues support, bind together, and protect tissues and organs. Examples include bone, blood, and adipose (fat) tissue.
  3. Muscle Tissue: Muscle tissue is responsible for movement. It is divided into three types:
    • Skeletal Muscle: Voluntary muscles attached to bones.
    • Cardiac Muscle: Involuntary muscle found in the heart.
    • Smooth Muscle: Involuntary muscle found in internal organs.
  4. Nervous Tissue: Nervous tissue is involved in receiving stimuli and transmitting electrical impulses. It consists of neurons and supporting cells.
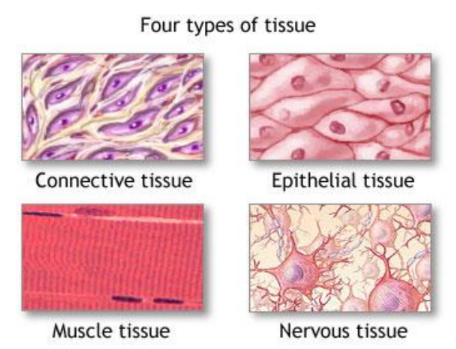
A visual representation of four types of tissues from class 9 science chapter 6 - Tissues

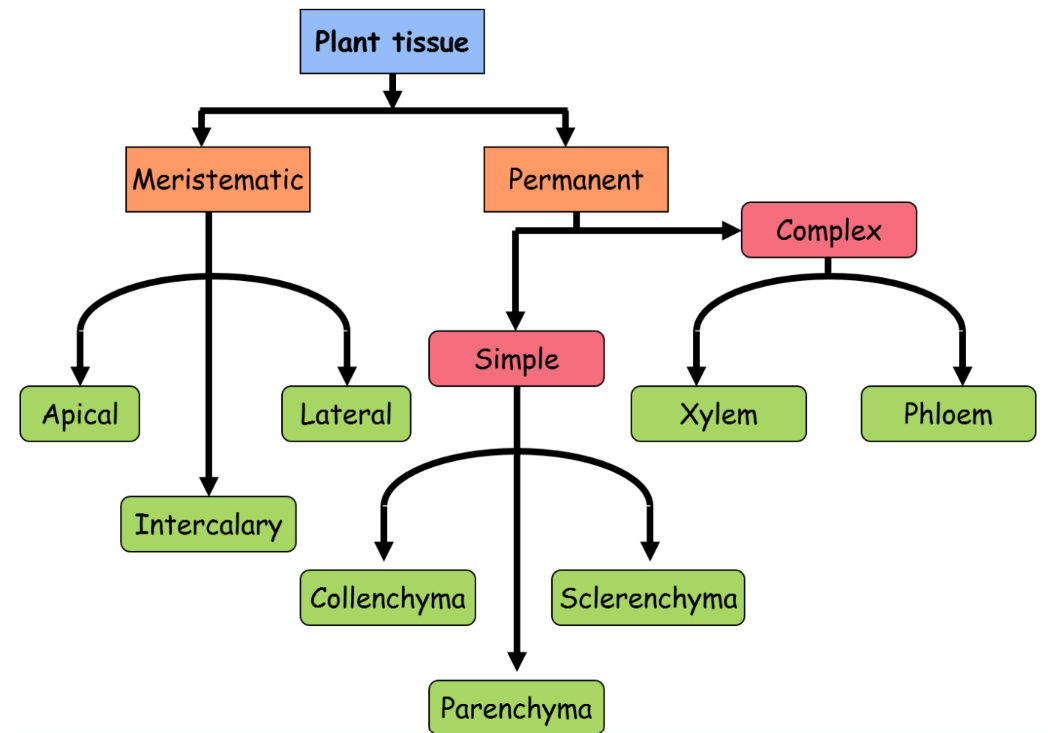
Types of Tissues in Plants

A visual representation of types of tissues in plants from class 9 science chapter 6 - Tissues

Plant tissues are categorized into two main types:

  1. Simple Tissue: Composed of a single type of cell, simple tissues include:
    • Parenchyma: Involved in photosynthesis and storage.
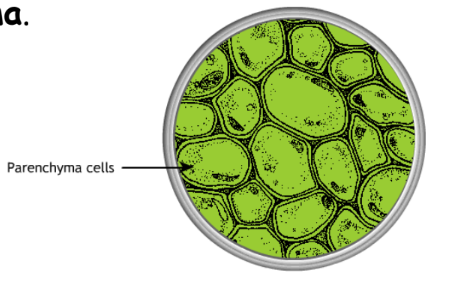
A visual representation of parenchyma cells from class 9 science chapter 6 - Tissues
  • Collenchyma: Provides structural support.
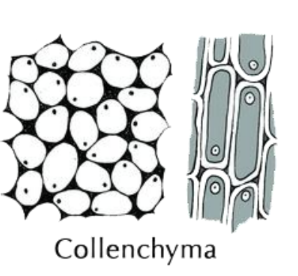
A visual representation of cholenchyma cells from class 9 science chapter 6 - Tissues
  • Sclerenchyma: Offers rigidity and strength.
  1. Complex Tissue: Made up of more than one type of cell, complex tissues include:
    • Xylem: Responsible for water and mineral transport.
    • Phloem: Transports nutrients and food throughout the plant.
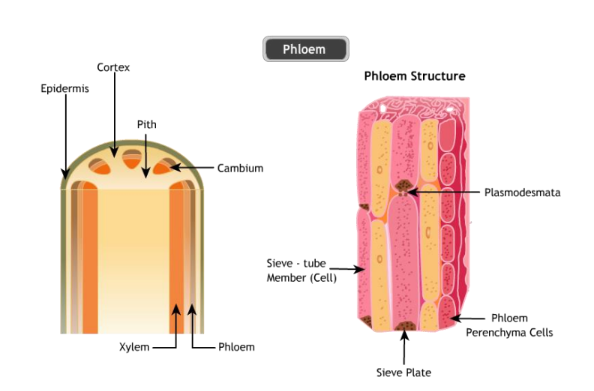
A visual representation of complex tissues from class 9 science chapter 6 - Tissues

The Role of Tissues in Organisms

Tissues are essential for the proper functioning of both plant and animal organisms. They work together to maintain homeostasis, perform specialized functions, and ensure survival. Understanding tissues helps us appreciate the complexity of life and the intricacies of how living organisms are structured and function.

In summary, our exploration of “Tissues” in Class 9 Science Chapter 6 has provided a comprehensive overview of the fundamental building blocks of life. The study of tissues—whether it be the epithelial layers, connective tissues, muscle tissues, nervous tissues in animals, or the xylem and phloem in plants—reveals the intricate and essential roles these structures play in sustaining life. Understanding how tissues function and collaborate within organisms enhances our grasp of biological processes and the complex interplay between different tissue types.

This chapter serves as a critical foundation for further studies in biology, offering insights into how cells form specialized structures that perform vital functions. By mastering the concepts in “Tissues,” students can better appreciate the dynamic nature of living organisms and their various systems. Whether you are preparing for exams or seeking to deepen your knowledge, our resources are designed to support and enhance your learning journey. Dive into Class 9 Science Chapter 6 – Tissues with confidence and curiosity, knowing that each type of tissue is a crucial piece of the larger puzzle of life.

Practice questions on Chapter 6 - Tissues

Get your free Chapter 6 - Tissues practice quiz of 20+ questions & detailed solutions

Practice Now
Science

Chapter 6 - Tissues

Learn more about iPrep

Download the App

Watch lectures, practice questions and take tests on the go.

Structure of the Atom – Complete Guide For Class 9 Science Chapter 4

Welcome to iPrep, your Learning Super App. Our learning resources for the chapter,  Structure of the Atom in Science Class 9th Chapter 4 are designed to ensure that you grasp this concept with clarity and perfection. Whether you’re studying for an upcoming exam or strengthening your concepts, our engaging animated videos, practice questions and notes offer you the best of integrated learning with interesting explanations and examples.

The concept of “Structure of the Atom” in Class 9 Science introduces students to the fundamental building blocks of matter, providing a detailed understanding of how atoms are composed and how they function. It covers the historical development of atomic theory, the discovery of subatomic particles, and the various models proposed by scientists to explain atomic structure. This topic also explores concepts such as atomic number, mass number, isotopes, and electronic configuration, helping students grasp the intricate details of atomic composition. By studying the structure of the atom, students gain a foundational understanding that is essential for further studies in chemistry and related scientific disciplines.

Introduction to the Structure Of The Atom

Atoms are the fundamental building blocks of matter. Understanding the structure of the atom is crucial for comprehending the nature of substances and their interactions. This topic provides an in-depth exploration of atomic models, the discovery of subatomic particles, and the arrangement of electrons within atoms.

a visual representation of proton and electron from class 9 science chapter 4 - Structure of the atom

Early Models of the Atom

  • Dalton’s Atomic Theory: John Dalton proposed that atoms are indivisible particles that make up all matter. He suggested that each element consists of identical atoms, and compounds form by combining atoms in fixed ratios.
  • Thomson’s Model: J.J. Thomson discovered the electron and proposed the “plum pudding” model, where electrons were embedded in a positively charged “soup.”
a visual representation of early models of atom from class 9 science chapter 4 - Structure of the atom
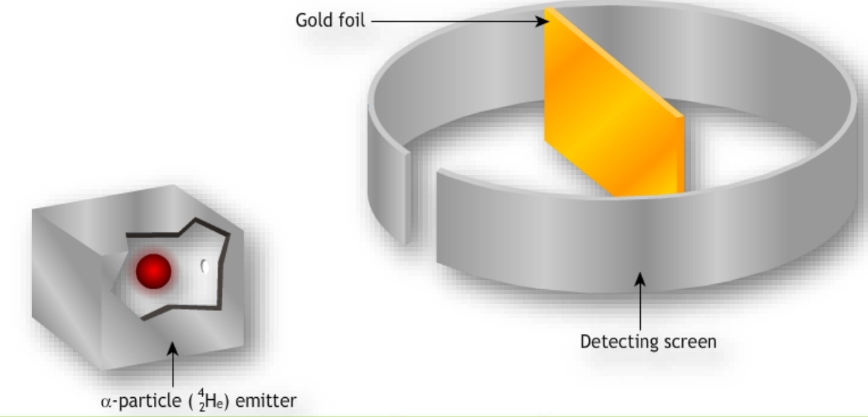
  • Rutherford’s Model: Ernest Rutherford conducted the gold foil experiment, revealing that atoms have a small, dense nucleus surrounded by electrons. This led to the nuclear model of the atom.
a visual representation of Rutherford's model from class 9 science chapter 4 - Structure of the atom

Discovery of Subatomic Particles

  • Electrons: Discovered by J.J. Thomson, electrons are negatively charged particles that orbit the nucleus.
  • Protons: Discovered by Ernest Rutherford, protons are positively charged particles located within the nucleus.
  • Neutrons: Discovered by James Chadwick, neutrons are neutral particles that also reside in the nucleus.

Bohr’s Model of the Atom

Niels Bohr refined Rutherford’s model by introducing quantized electron orbits. He proposed that electrons travel in specific orbits around the nucleus and can jump between these orbits by absorbing or emitting energy.

Electron Configuration

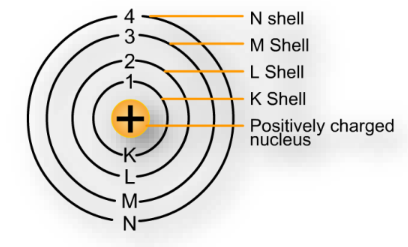
  • Energy Levels: Electrons occupy discrete energy levels or shells around the nucleus, labeled K, L, M, and so on.
a visual representation of electron configuration from class 9 science chapter 4 - Structure of the atom
  • Subshells and Orbitals: Each energy level contains subshells (s, p, d, f), which further contain orbitals. Electrons fill these orbitals following specific rules.

Atomic Number and Mass Number

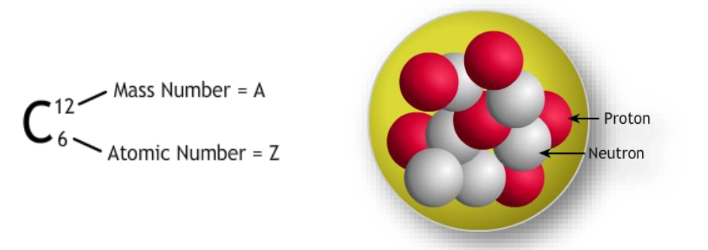
  • Atomic Number (Z): The number of protons in the nucleus, which determines the element’s identity.
  • Mass Number (A): The total number of protons and neutrons in the nucleus.
a visual representation of atomic number and mass number from class 9 science chapter 4 - Structure of the atom

Isotopes

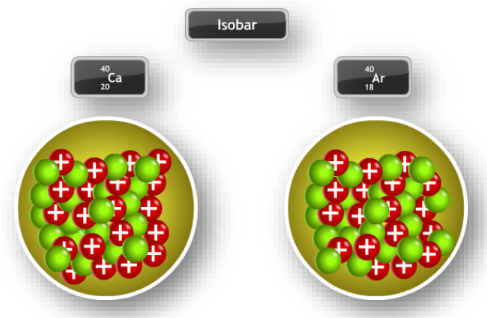
Isotopes are atoms of the same element with different mass numbers, due to varying numbers of neutrons. For example, Carbon-12 and Carbon-14 are isotopes of carbon.

a visual representation of isotopes from class 9 science chapter 4 - Structure of the atom

Applications of Atomic Structure

Understanding atomic structure is fundamental in fields such as chemistry, physics, and biology. It aids in explaining chemical reactions, bonding, and the properties of materials.

In conclusion, Class 9 Science Chapter 4 – Structure of the Atom provides a crucial foundation for understanding the basic building blocks of matter. By exploring the various models of atomic structure, from Dalton’s theory to Bohr’s quantized orbits, students gain a comprehensive understanding of how atoms are composed and function. The chapter also delves into the discovery of subatomic particles, the concept of isotopes, and electron configuration, all of which are essential for further studies in chemistry and other scientific fields. With the Structure of the Atom as a key chapter, students are well-prepared to tackle more complex concepts in future lessons. iPrep’s resources for Class 9 Science Chapter 4 – Structure of the Atom ensure that you can master these concepts with engaging videos, practice questions, and detailed notes. Dive deeper into the Structure of the Atom and enhance your learning with iPrep!

Practice questions on Chapter 4 - Structure of the Atom

Get your free Chapter 4 - Structure of the Atom practice quiz of 20+ questions & detailed solutions

Practice Now
Science

Chapter 4 - Structure of the Atom

Learn more about iPrep

Download the App

Watch lectures, practice questions and take tests on the go.

Complete Guide For Class 9 Math Chapter 12 – Statistics

Our learning resources for Mathematics Class 9 ‘Statistics’ chapter 12 are designed to ensure that you grasp this concept with clarity and perfection. Whether you’re studying for an upcoming exam or strengthening your concepts, our engaging animated videos, practice questions, and notes offer you the best of integrated learning with interesting explanations and examples.

Our comprehensive approach ensures that you have access to everything you need to have an in-depth understanding of the chapter Statistics. From detailed notes to interactive exercises, our materials are tailored to meet your learning needs and help you excel in your studies. Get ready to dive into an enriching educational experience that will make mastering this chapter a breeze.

Statistics is the art of collecting, organizing, analyzing, interpreting, and presenting data. This chapter introduces you to basic statistical concepts. Learn about raw data, frequency distribution tables, grouped data, and measures of central tendency like mean, median, and mode. Understand how to handle large datasets and draw meaningful conclusions from them.

Welcome to another insightful exploration of Class 9 Mathematics! In this blog, we will dive into Chapter 12 – Statistics. This chapter provides a comprehensive understanding of the fundamentals of statistics, its definition, types of data, and various methods of data presentation and analysis. Let’s get started!

Introduction to Statistics

Definition of Statistics

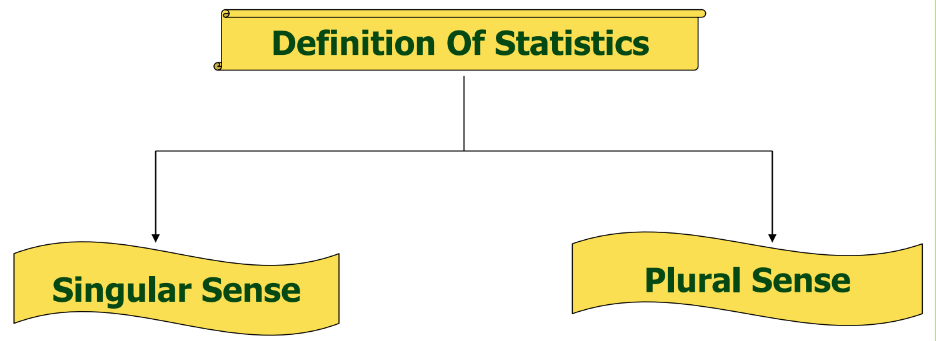
Statistics is a branch of mathematics that deals with the collection, presentation, analysis, and interpretation of numerical data. The term “statistics” can be understood in both singular and plural senses:

a visual representation of the definition of statistics from class 9 math
  • Singular Sense: It refers to the science of collecting, presenting, analyzing, and interpreting numerical data.
  • Plural Sense: It denotes numerical facts or observations collected with a specific purpose.

For example, the number of males and females in a particular city is a statistical data point.

Types of Statistical Data

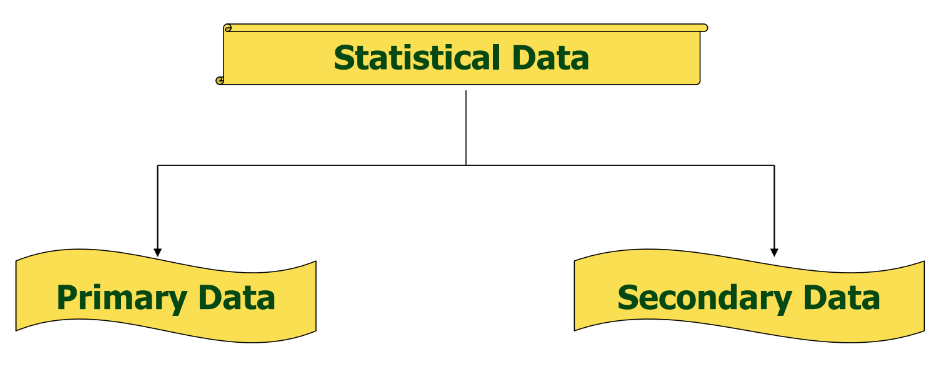
Statistical data can be classified into two main categories: Primary Data and Secondary Data.

image 322

Primary Data

Primary data is the data collected firsthand by an investigator with a specific plan or design in mind. It is:

  • Reliable
  • Relevant
  • Original

Example: Data obtained from a population census by the office of the Registrar General and Census Commissioner.

Secondary Data

Secondary data is the data that has been collected by someone else and is obtained from published or unpublished sources. It requires greater care to ensure its relevance and accuracy.

Example: Using the latest copy of ‘Educational Statistics of India’ to find the literacy rate of India.

Presentation of Data

Once data is collected, it needs to be presented in a way that highlights its key features. This process is called data presentation. For instance, consider the marks obtained by five students in a Mathematics test (out of 100):

80, 95, 72, 90, 69

In its raw form, this data can be arranged in various ways:

  • Serial or Alphabetical order
  • Ascending order
  • Descending Order

When raw data is arranged in ascending or descending order, it is called an array or array data.

Constructing Frequency Distributions

To analyze data more effectively, it can be organized into frequency distributions. There are two types of frequency distributions: Discrete and Grouped.

Discrete Frequency Distribution

Steps to Construct:

  1. Obtain the raw data.
  2. Prepare a table with three columns: one for the variable (e.g., marks), one for tally marks, and one for the frequency.
  3. Arrange the data in ascending order.
  4. Use tally marks to record the frequency of each value.
  5. Summarize the tally marks to obtain the frequency for each value.

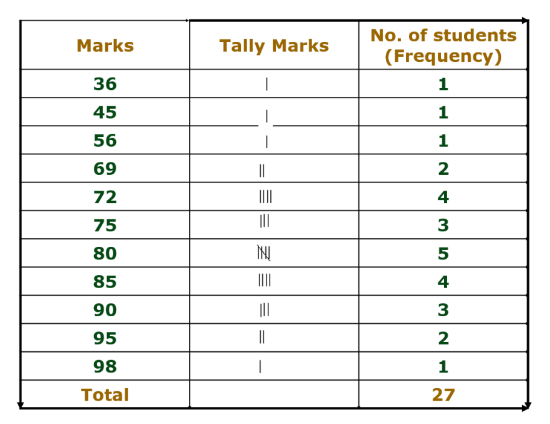
Example: Consider the marks obtained by 27 students:

80, 95, 72, 90, 69, 80, 75, 75, 90, 85, 72, 80, 85, 75, 85, 72, 85, 98, 72, 45, 36, 80, 95, 69, 90, 56, 80

The resulting frequency distribution table will show the number of students who obtained each mark.

image 324

This is called an ungrouped frequency distribution or a frequency distribution table.

Grouped Frequency Distribution

When data is extensive, it can be grouped into classes or intervals. Each class has a range, known as the class interval.

Steps to Construct:

  1. Determine the maximum and minimum values in the data.
  2. Decide the number of classes (usually 5 to 15).
  3. Calculate the class interval.
  4. Assign each data point to a class and record the tally marks.
  5. Summarize the tally marks to get the frequency for each class.

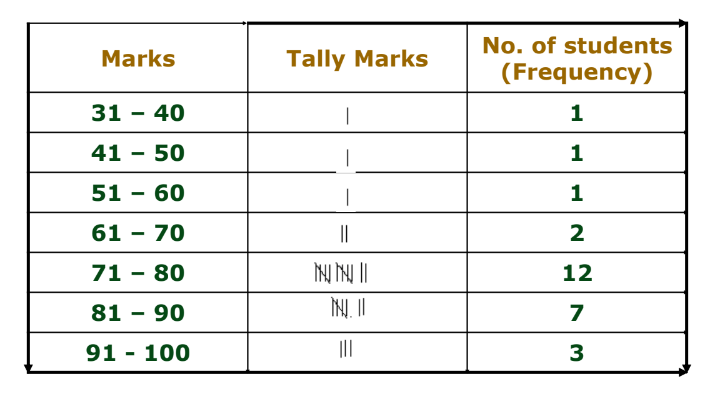
Example: Marks of students grouped into intervals:

image 321

This is known as a grouped frequency distribution.

Note: This is the inclusive method.

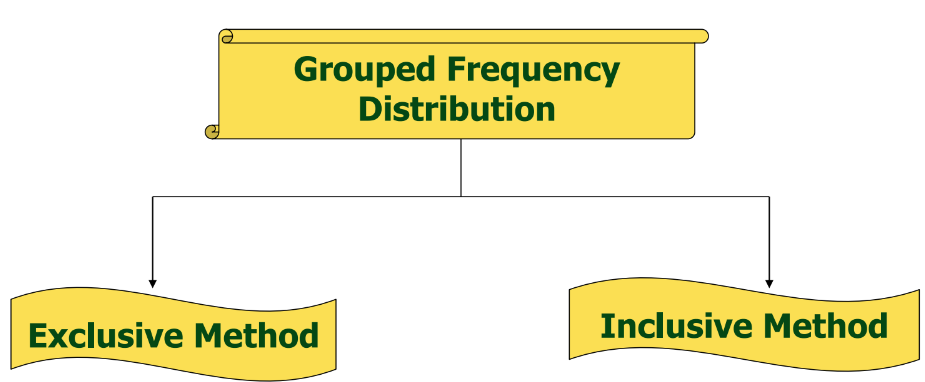
Grouped Frequency Distribution:

image 328

Exclusive Method: When the class intervals are so fixed that the upper limit of one class is the lower limit of the next class, it is known as the exclusive method of classification.

In this method, the upper limit of a class is not included in the class.

Inclusive Method: In the inclusive method of classification, the classes are so formed that the upper limit of a class is included in that class.

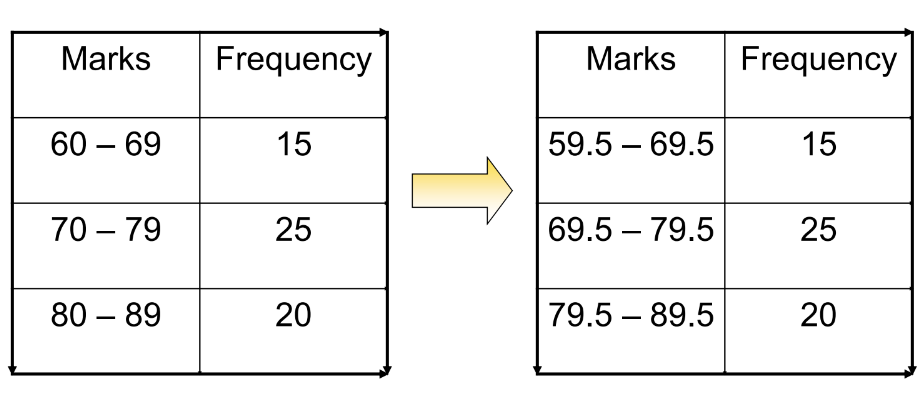
How to convert from Inclusive to Exclusive Form: 

  • Find the difference between the upper limit of a class and the lower limit of its succeeding class. Denote this by h.
  • Add half of this difference to each of the upper limits of the class – intervals.
  • Subtract half of this difference from each of the lower limits of the class – intervals.
  • So, if (a – b) is a class in an inclusive method, then in an exclusive method it becomes

 { (a – h/2) – (b + h/2) }.

Now, look at the example given below:

image 323

Points to remember:

  • Classmark = Upper Limit + Lower Limit / 2
  • Range = Maximum Value – Minimum value

Graphical Representation of Data

Data can also be represented graphically for better visualization. Common graphical methods include:

  • Bar Graphs: Pictorial representation using bars of uniform width.
image 327

Algorithm:

  1. Take a graph paper and draw two lines perpendicular to each other and call them horizontal and vertical axes.
  2. Along the horizontal axis, mark the information given in the data like days, weeks, places, etc. at uniform gaps.
  3. Choose a suitable scale to determine the heights of the rectangles or bars and then mark the heights on the vertical axis.
  4. Drawbars or rectangles of equal width and height are marked in Step 3 on the horizontal axis with equal spacing between them.
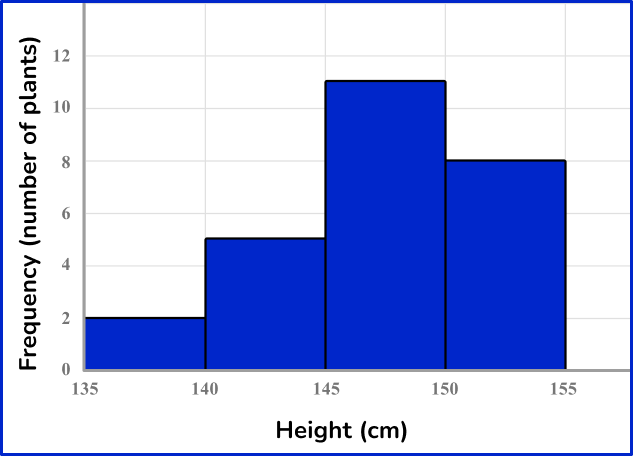
  • Histograms: Graphical representation using rectangles where class intervals are the bases, and heights are proportional to frequencies.
image 326

Algorithm:

  1. Take a graph paper and draw two perpendicular lines, one horizontal (representing X-axis) and one vertical (representing Y-axis), intersecting at O(say). Mark them as OX and OY.
  2. Choose a suitable scale along the X-axis and represent class limits on it.
  3. Choose a suitable scale for the Y-axis and mark frequencies along the Y-axis.
  4. Construct rectangles with class intervals as bases and respective frequencies as heights.

NOTE: The scale for the X-axis may not be the same as the scale for Y-axis.

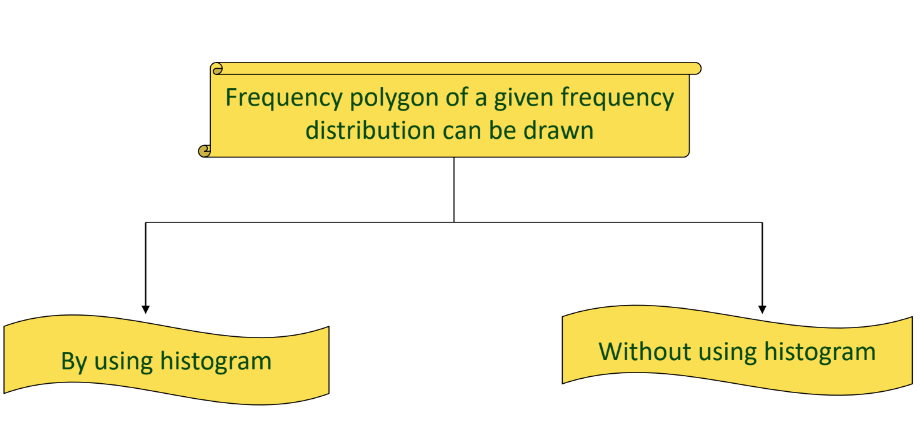
  • Frequency Polygons: Line graphs connecting the midpoints of class intervals.
image 329

Measures of Central Tendency

Central tendency measures provide a single value that represents the center of a data set. The commonly used measures are:

  • Arithmetic Mean (Average): Sum of all observations divided by the number of observations.
  • Median: Middle value that divides the data into two equal parts.
  • Mode: Most frequently occurring value.

Arithmetic Mean: The mean or average of several observations is the sum of values of the values of all the observations divided by the total number of observations.

Example: Arithmetic Mean

If five people spend the following hours in social work: 10, 7, 13, 20, 15, the mean is calculated as:

Mean = 10+7+13+20+15/5 =13

Median: The median of a distribution is the value of the variable that divides the distribution into two equal parts i.e. it is the value of the variable such that the number of observations above it is equal to the number of observations below it.

Algorithm

  1. Arrange the observations(values of the variate) in ascending or descending order of magnitude.
  2. Determine the total number of observations, say, n.
  3. If n is, then Median = Value of (n + 1)/2 th observation.
  4. If n is , then Median = {Value of (n/2)th observation + Value of (n + 1)/2 th observation}/2.

Example: Median

For the data: 25, 34, 31, 23, 22, 26, 35, 28, 20, 32, the median is:

  1. Arrange the data: 20, 22, 23, 25, 26, 28, 31, 32, 34, 35.
  2. Since n = 10, the median is the average of the 5th and 6th values:

Median = 26+28/2 = 27

Mode: Mode is the value that occurs most frequently in a set of observations and around which the other items of the set cluster densely. Thus, the mode of a frequency distribution is the value of the variable which has a maximum frequency.

Example: Mode 

Find the mode of the following data: 110, 120, 130, 120, 110, 140, 130, 120, 140, 120.

Since the value 120 occurs a maximum number of times i.e. 4. Hence, the modal value is 4.

Note: In a moderately symmetric distribution mean, median, and mode are connected by the following formula :

Mode = 3 Median – 2 Mean

Understanding statistics is crucial for analyzing and interpreting data effectively. By mastering the concepts of data collection, presentation, and central tendency measures, students can make informed decisions based on statistical data. Keep practicing these concepts to enhance your statistical skills!

In this blog, we explored the intricacies of Class 9 Math Chapter 12 – Statistics. This chapter is essential for developing a solid foundation in the principles of statistics, including data collection, presentation, and analysis. We covered the different types of data, methods of organizing data through frequency distributions, and various graphical representations like bar graphs and histograms. Additionally, we delved into measures of central tendency such as mean, median, and mode, which are fundamental for interpreting data accurately.

Mastering Chapter 12 – Statistics equips you with valuable skills for handling and analyzing data effectively. Whether you’re preparing for exams or aiming to strengthen your understanding, our comprehensive resources are here to guide you through every step. Embrace the study materials and practice exercises to excel in Statistics and enhance your overall mathematical proficiency. Remember, the more you practice, the more proficient you’ll become in applying statistical methods to real-world scenarios. Keep exploring and refining your skills in Chapter 12 – Statistics, and you’ll find yourself well-prepared for any data analysis challenge that comes your way!

Practice questions on Chapter 12 - Statistics

Get your free Chapter 12 - Statistics practice quiz of 20+ questions & detailed solutions

Practice Now
Math

Chapter 12 - Statistics

Learn more about iPrep

Download the App

Watch lectures, practice questions and take tests on the go.

Complete Guide For Class 9 Math Chapter 11 – Surface Areas and Volumes

Our learning resources for Mathematics Class 9 ‘Surface Areas and Volumes’ chapter 11 are designed to ensure that you grasp this concept with clarity and perfection. Whether you’re studying for an upcoming exam or strengthening your concepts, our engaging animated videos, practice questions, and notes offer you the best of integrated learning with interesting explanations and examples.

Our comprehensive approach ensures that you have access to everything you need to have an in-depth understanding of the chapter Surface Areas and Volumes. From detailed notes to interactive exercises, our materials are tailored to meet your learning needs and help you excel in your studies. Get ready to dive into an enriching educational experience that will make mastering this chapter a breeze.

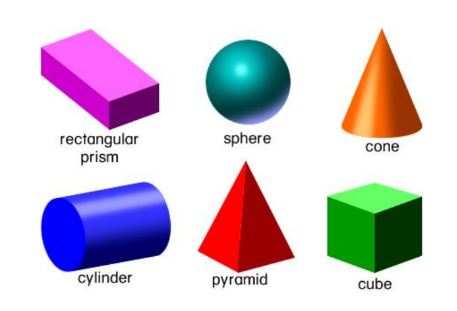
Chapter 11, “Surface Area and Volume,” introduces students to calculate the surface area and volume of various 3D shapes, including cubes, cuboids, cylinders, cones, spheres, and hemispheres. It covers the derivation of formulas and practical applications. Emphasis is on understanding and applying these formulas to solve real-world problems, enhancing spatial reasoning and mathematical modeling skills.

Welcome to the fascinating world of 3-dimensional geometry! In this chapter, we explore solid figures, including cuboids, cubes, cylinders, cones, and spheres, learning how to calculate their surface areas and volumes. By mastering these concepts, you’ll be able to solve real-life problems involving various geometrical shapes.

Introduction to Solid Figures

Until now, we have focused on plane figures like circles, squares, and rectangles. Now, we shift our attention to solid figures, which have three dimensions. Examples include cuboids, cubes, and cylinders. Let’s delve into the formulas for their surface areas and volumes.

a visual illustration of solid shapes from the class 9 math chapter 11 - Surface Areas And Volumes

Surface Area of Cuboids and Cubes

Cuboid: A solid figure bounded by six rectangular plane regions.

a visual representation of area of cubes and cuboids from class 9 math chapter surface areas and volumes
  • Faces: Six rectangular faces.
  • Edges: Twelve edges where adjacent faces meet.
  • Lateral Faces: Four faces that meet the base of the cuboid.

Total Surface Area of a Cuboid: TSA = 2(lb+bh+lh)

 Lateral Surface Area of a Cuboid: LSA = 2(l+b)h

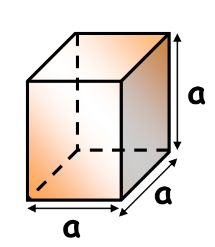
Cube: A cuboid with equal length, breadth, and height. 

image 313

Total Surface Area of a Cube: TSA = 6a²

Lateral Surface Area of a Cube: LSA = 4a²

Examples

  1. Cuboid Tiffin Box: Find the surface area for dimensions 16 cm x 8 cm x 6 cm. 
image 307

Solution: TSA = 2(16×8+8×6+6×16) = 2 ×272 = 544 cm²

  1. Dimensions Ratio: A cuboid with a surface area of 88 m² and dimensions in a 1:2:3 ratio. Find the dimensions of the cuboid.

Solution: The length, breadth, and height are l, 2l, and 3l respectively.

Then T.S.A of the cuboid = 2(lb+bh+hl)

88 = 2(lx2l + 2lx3l + lx3l)

88 = 2(2l² + 6l² + 3l²)

l² = 4

l = 2

Thus the dimensions are 2m, 4m, 6m.

Cylinder

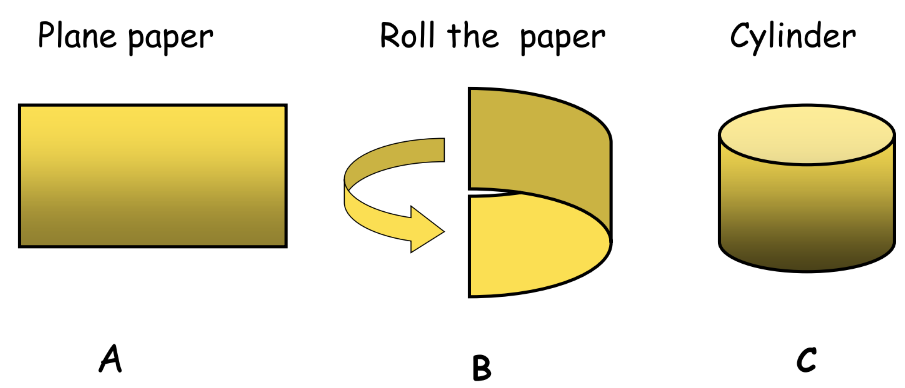
A cylinder is formed by rolling a rectangular sheet.

image 316

Curved Surface Area (CSA): CSA = 2πrh

Total Surface Area: TSA = 2πr(r+h)

Examples

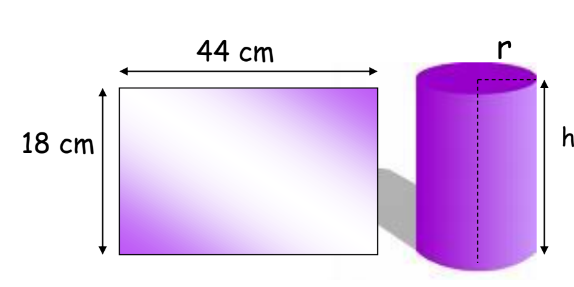
  1. Rectangular Sheet to Cylinder: A rectangular sheet of paper 44 cm x 18 cm is rolled along its length and a cylinder is formed. Find the radius of the cylinder.

Solution: The length of the rectangular sheet forms the circumference of the base, and the breadth becomes the height of the cylinder.

image 306

             2πr = 44

             2 × 22/7 × r = 44

             r = 44 × 7 /2 × 22 = 7 cm

  1. Hot Water Heating System: In a hot water heating system, there is a cylindrical pipe of length 28 m and the diameter is 5 cm. Find the total radiating surface in the system.

Solution: The total radiating surface = 2πrh

Length = height = 28 m

radius = 5 cm = 5/200 m

Therefore the curved surface area = 2 × 22/7 × 5/200 × 28 = 4.4 m²

Cones

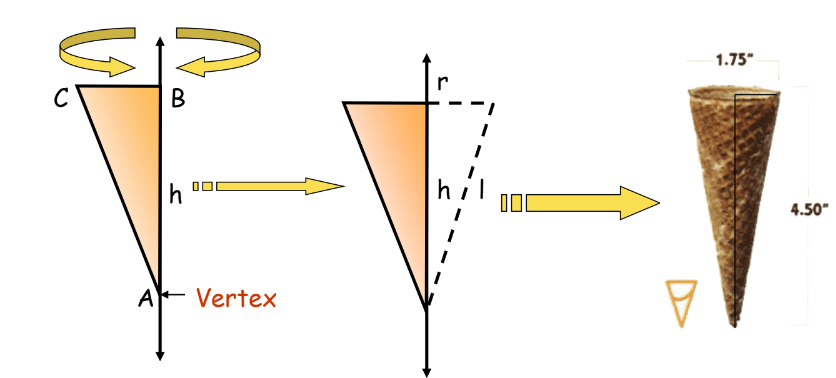
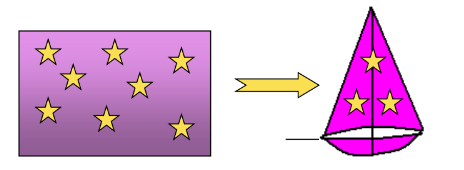
A cone is formed by rotating a right-angled triangle around one of its legs.

image 309

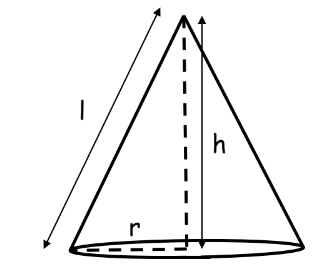
Curved Surface Area: CSA = πrl

Total Surface Area: TSA = πr(l+r)

Examples

  1. Curved Surface Area: The radius of a cone is 3 cm and its vertical height is 4 cm. Find the area of its curved surface.

Solution: We have radius = 3 cm and h = 4 cm . Let l be the slant height of the cone

image 315

l ² = r² + h²

l² = 3² + 4²

l² = 9 + 16

l² = 25

l = 5

Therefore Curved surface area = πrl = 22/7 × 3 ×4 = 141.3 cm²

  1. Cloth for Conical Tent: How many meters of cloth 5 m wide will be required to make a conical tent, the radius of whose base is 7 m and whose height is 24 m?

Solution: According to the question 

image 320

l² = r² + h²

l² = 7² + 24²

l² = 49 + 576

l² = 625

l = 5

Area of the cloth = Curved surface area of the tent

l × b = πrl

l × 5 = 22/7 × 7 × 25

l =  110m

Spheres and Hemispheres

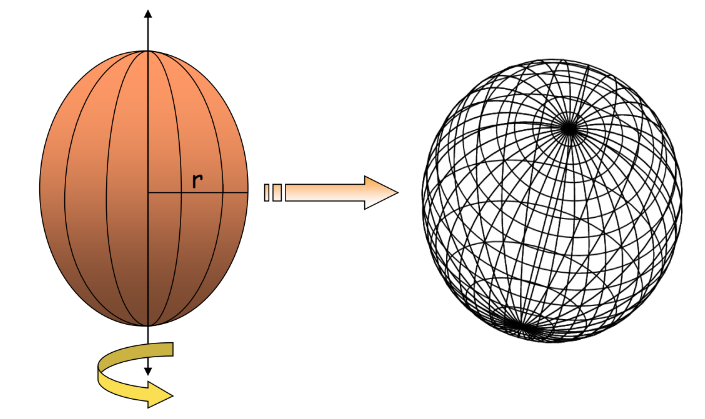
Sphere Surface Area: SA = 4πr²

image 317

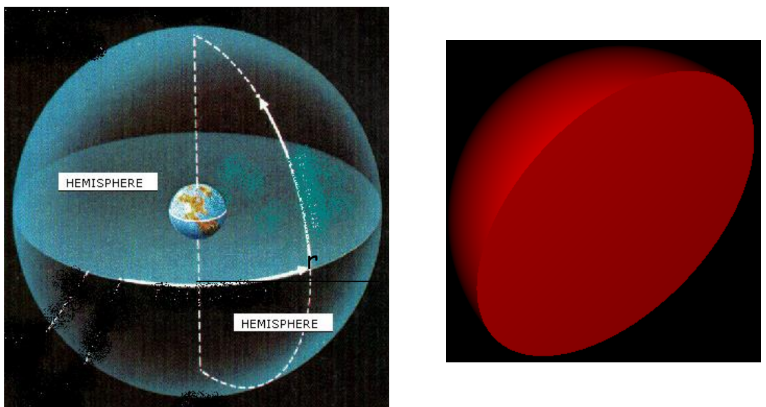
Hemisphere Curved Surface Area: CSA = 2πr²

image 319

Total Surface Area of Hemisphere: TSA = 3πr²

Volumes of Solid Shapes

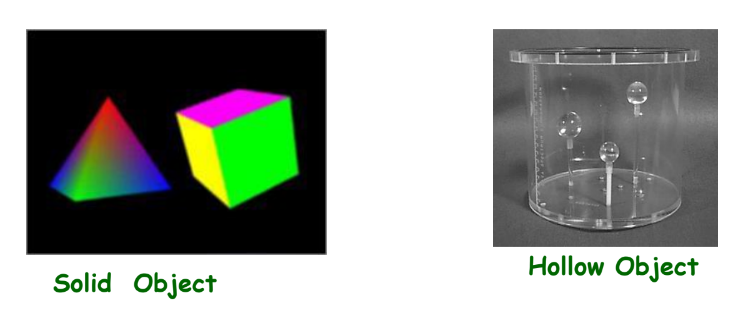
The space occupied by a solid object is its volume. For hollow objects, the capacity is measured.

image 311

Cuboid and Cube

image 312

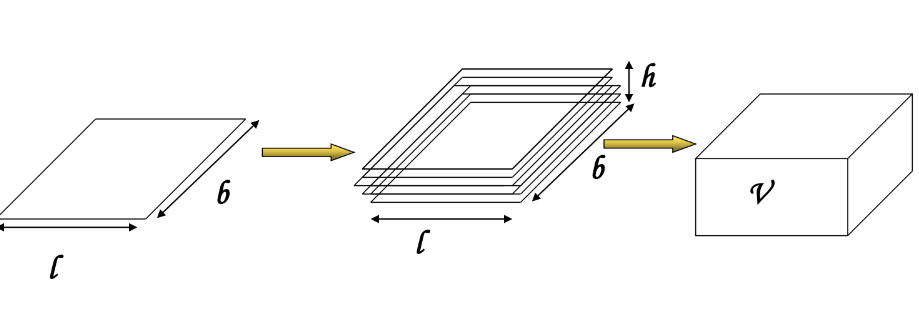
Volume of a Cuboid: V = l × b × h

Volume of a Cube: V = a³

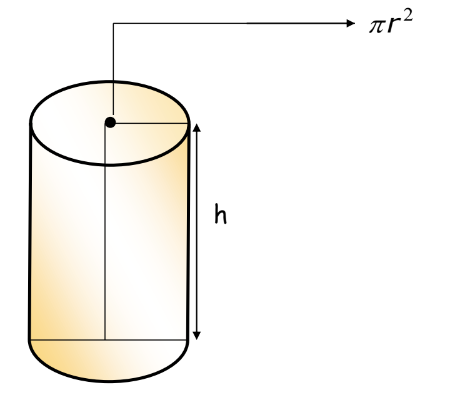
Cylinders

image 318

Volume of a Cylinder: V = πr²h

Hollow Cylinder: V = πh(R²−r²)

Cones

image 314

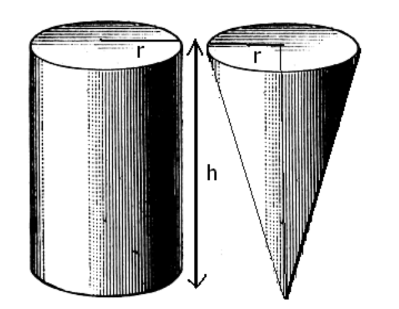
Volume of a Cone: V = 1/3πr²h 

Suppose there is a cone and a cylinder of the same height and the same radius.

The volume of the cone = 1/3 × Volume of the cylinder

V = 1/3πr²h

Sphere and Hemisphere

image 308

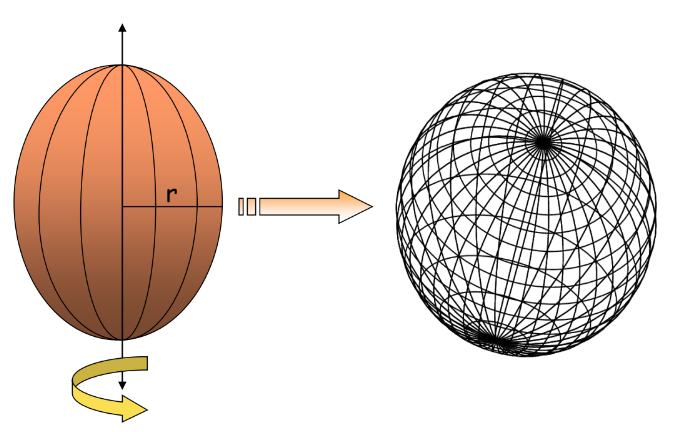
Volume of Sphere = 4/3 × πr³

Volume of Hemisphere = 2/3 × πr³

Understanding surface areas and volumes is crucial for solving practical problems involving three-dimensional shapes. By mastering these formulas and concepts, students can effectively tackle various geometrical challenges.

In conclusion, Chapter 11 – Surface Areas and Volumes of Class 9 Mathematics provides a thorough exploration of three-dimensional geometry. By understanding the key concepts and formulas for calculating the surface areas and volumes of various solid figures such as cuboids, cubes, cylinders, cones, spheres, and hemispheres, students gain valuable skills applicable to both academic and real-world scenarios.

Our resources for Surface Areas and Volumes ensure a comprehensive learning experience. With engaging animated videos, detailed notes, and practice questions, you will be well-equipped to master this chapter with ease. Whether you’re preparing for exams or seeking to reinforce your understanding, our materials are designed to enhance your grasp of Surface Areas and Volumes and help you excel in your studies.

By delving into the principles of Surface Areas and Volumes, you will improve your spatial reasoning and problem-solving abilities. Remember, mastering these concepts opens doors to tackling more complex geometrical problems, making your mathematical journey both enriching and rewarding. So, embrace the challenge and enjoy the learning process as you explore the fascinating world of Surface Areas and Volumes.

Practice questions on Chapter 11 - Surface Areas And Volumes

Get your free Chapter 11 - Surface Areas And Volumes practice quiz of 20+ questions & detailed solutions

Practice Now
Math

Chapter 11 - Surface Areas And Volumes

Learn more about iPrep

Download the App

Watch lectures, practice questions and take tests on the go.

Complete Guide For Class 9 Math Chapter 10 – Heron’s Formula

Our learning resources for Mathematics Class 9 Heron’s Formula are designed to ensure that you grasp this concept with clarity and perfection. Whether you’re studying for an upcoming exam or strengthening your concepts, our engaging animated videos, practice questions, and notes offer you the best of integrated learning with interesting explanations and examples.

Our comprehensive approach ensures that you have access to everything you need to have an in-depth understanding of the chapter Heron’s Formula. From detailed notes to interactive exercises, our materials are tailored to meet your learning needs and help you excel in your studies. Get ready to dive into an enriching educational experience that will make mastering this chapter a breeze.

Chapter 10: Heron’s Formula in Class 9 Mathematics introduces a method to calculate the area of a triangle when the lengths of all three sides are known. This formula, attributed to the ancient mathematician Heron of Alexandria, provides a practical approach to solving real-world problems involving triangular plots of land and various geometric applications.

We all know the area of a triangle can be calculated if we know the base and altitude. However, there may be cases when the height is not known. Let us analyze various conditions.

Calculation of Area of a Right-Angled Triangle

According to the chapter heron’s formula, in any right-angled triangle, we can calculate its area if the base and the perpendicular are known.

a visual representation of Calculation of Area of a Right-Angled Triangle with herons formula

Area = 1/2 × Base × Height

Example: Area = 1/2 × BC × AB

Note: We can take the base as BC or AB; that will not make any difference in the calculation of its area.

Calculation of Area of an Equilateral Triangle

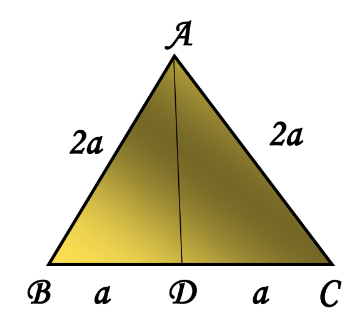
We draw the perpendicular from vertex A of the triangle. In an equilateral triangle, the perpendicular bisects the opposite side of the triangle.

image 302

AD = √AB² − BD²

AD = √(2a)² − (a)²

AD = √4a² − a² ​

AD = √3a² = a√3​​

Calculation of the area of an equilateral triangle:

Area = 1/2 × Base × Height

Area = 1/2 × BC × AD

Area = 1/2 × 2a × a√3

Area = a²√3​​

Calculation of the Area of an Isosceles Triangle

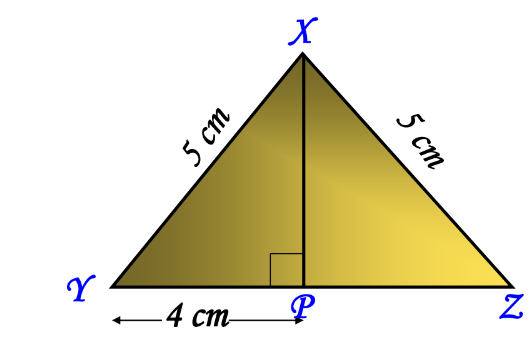
In an isosceles triangle, two of the sides are equal. Let us take an example of a triangle XYZ where the equal sides are 5 cm each and the unequal side is 8 cm.

image 303

The perpendicular XP divides the base YZ of the triangle into two equal parts.

Therefore, YP = PZ = 1/2YZ = 4 cm

To find the altitude by applying Pythagoras Theorem:

XP = √XY²−YP²​

XP = √5² − 4² ​

XP = √25 − 16 = √9 = 3 cm

Now, the area of the triangle:

Area = 1/2 × Base (YZ) × Height (XP)

Area = 1/2 × 8 × 3 = 12 cm² 

Heron’s Formula

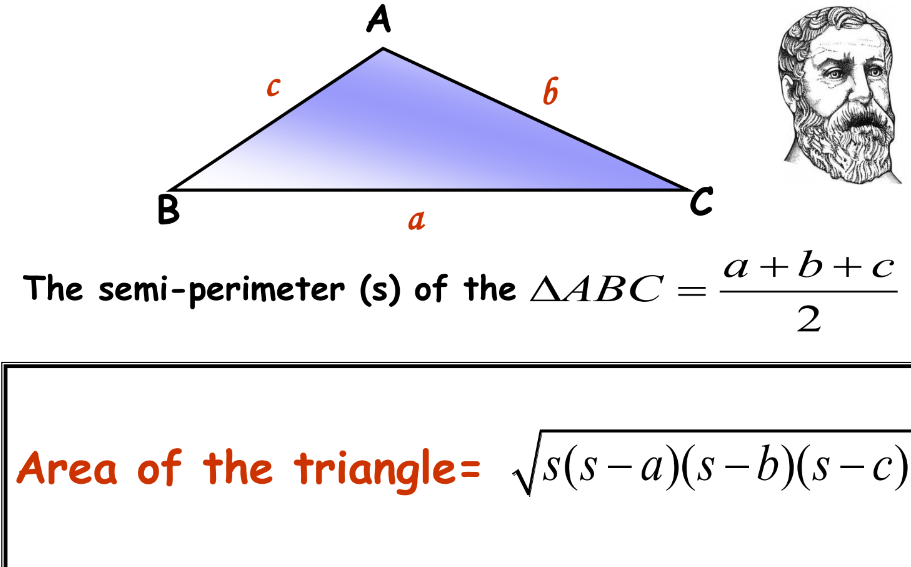
In a triangle ABC, let the side opposite to vertex A be denoted by a (side BC), the side opposite to vertex B be denoted by b (side AC), and the side opposite to vertex C be denoted by c (side AB).

image 305

The semi-perimeter (s) of ΔABC is given by:

S = a + b + c/2

The area of the triangle using Heron’s Formula:

Area = √s(s−a)(s−b)(s−c)​

Example 1

Find the area of a triangle whose sides are respectively 9 cm, 12 cm, and 15 cm.

Solution:

The semi-perimeter s = 9+12+15/2 = 18

Area = √18(18−9)(18−12)(18−15)​

Area = √18×9×6×3​

Area = √2916 = 54 cm²

Example 2

In a triangle ABC, AB = 15 cm, BC = 13 cm, and AC = 14 cm. Find the area of the triangle.

Solution:

The semi-perimeter S = 15+13+14/2 = 21

Area = √21(21−15)(21−13)(21−14)​

Area = √21×6×8×7​

Area = √7056 = 84 cm²

Example 3

The lengths of the sides of a triangle are in the ratio 3:4:5 and its perimeter is 144 cm. Find the area of the triangle and the height corresponding to the longest side.

Solution:

Let the sides be denoted by 3x, 4x, and 5x.

144 = 3x + 4x + 5x

144 = 12x

x = 12

Thus, the sides are 36 cm, 48 cm, and 60 cm.

The semi-perimeter S = 144/2 = 72

Area = √72(72−36)(72−48)(72−60)​

Area = √72×36×24×12 = 864 cm²

Now we need to find the altitude to the longest side:

Area = 1/2 × Base × Height

864 = 1/2 × 60 × Height

Height = 864 × 2/60 = 28.8 cm

Example 4

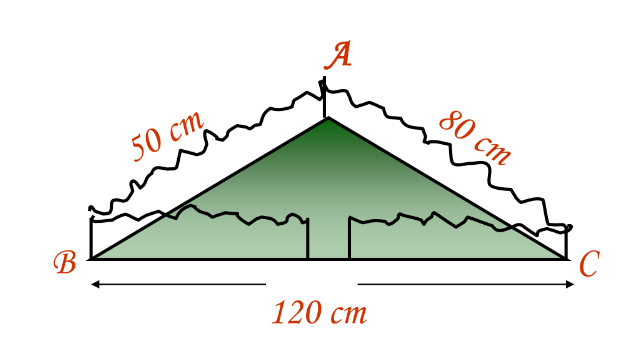
A triangular park ABC has sides 120 m, 80 m, and 50 m. The owner wants to put a fence all around it and also plant grass inside. How much area does he need to plant? Find the cost of fencing it with barbed wire at the rate of Rs. 50 per meter, leaving a space 3m wide for a gate on one side.

image 304

Solution:

Computation of area:

The semi-perimeter S = 120+80+50/2 = 125

Area = √125(125−120)(125−80)(125−50)​

Area = √125×5×45×75 = 3750 m²

Length of wire needed for fencing:

Perimeter of the park − Width of the gate = 250m − 3m = 247m

Cost of fencing:

Cost = Rs.50×247 = Rs.12,350

By understanding Heron’s Formula and its applications, students can easily calculate the area of various triangles and quadrilaterals, enhancing their problem-solving skills in geometry.

In summary, Chapter 10 – Heron’s Formula is a pivotal part of Class 9 Mathematics, offering a powerful tool for calculating the area of a triangle when all three side lengths are known. By mastering Heron’s Formula, you gain the ability to tackle a variety of geometric problems, from practical applications in real-world scenarios to solving complex exercises in your textbook. Our resources for Class 9 Math Chapter 10 – Heron’s Formula provides a thorough understanding through detailed notes, animated videos, and ample practice questions. With these tools, you can confidently approach any problem involving triangles and apply Heron’s Formula effectively. Embrace this chapter’s concepts to enhance your mathematical skills and excel in your studies.

Practice questions on Chapter 10 - Heron's Formula

Get your free Chapter 10 - Heron's Formula practice quiz of 20+ questions & detailed solutions

Practice Now
Math

Chapter 10 - Heron's Formula

Learn more about iPrep

Download the App

Watch lectures, practice questions and take tests on the go.

Complete Guide for Class 9 Math Chapter 9 – Circles

Welcome to iPrep, your Learning Super App. Our learning resources for the chapter, Circles in Mathematics Class 9th chapter 9 are designed to ensure that you grasp this concept with clarity and perfection. Whether you’re studying for an upcoming exam or strengthening your concepts, our engaging animated videos, practice questions and notes offer you the best of integrated learning with interesting explanations and examples.

Chapter 9 of Class 9 Mathematics focuses on Circles, exploring fundamental concepts such as the definition of a circle, its various components (radius, diameter, chord, secant, tangent, arc), and properties. The chapter delves into theorems related to angles subtended by chords, cyclic quadrilaterals, and tangent properties, providing a comprehensive understanding of the geometric principles and their applications.

Definition Of Circles

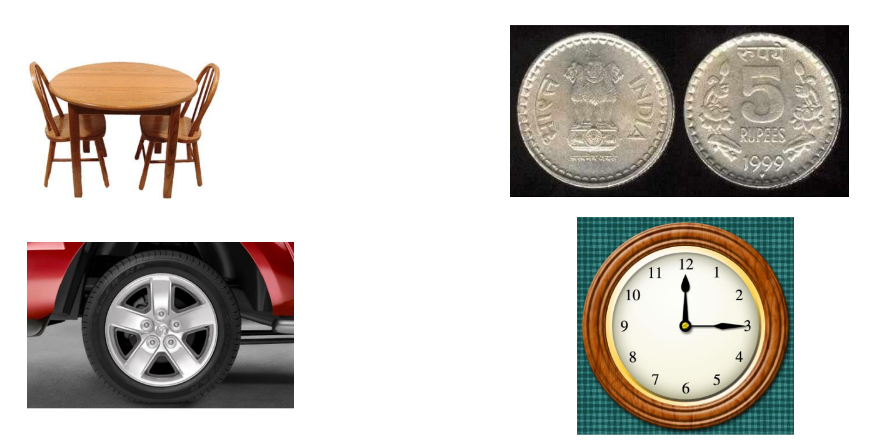
Circles are round objects. This chapter delves into the fundamental aspects of circles, their properties, and related theorems. For Example –

a visual representation of circles in various forms from class 9th math

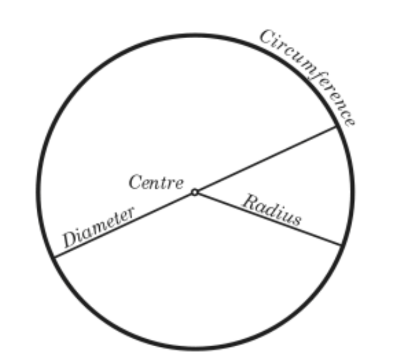
Related Terms

image 296
  • Circle: The collection of all points in a plane that are at a fixed distance from a fixed point in the plane.
  • Center: The fixed point of the circle.
  • Radius: The fixed distance from the center to any point on the circle.

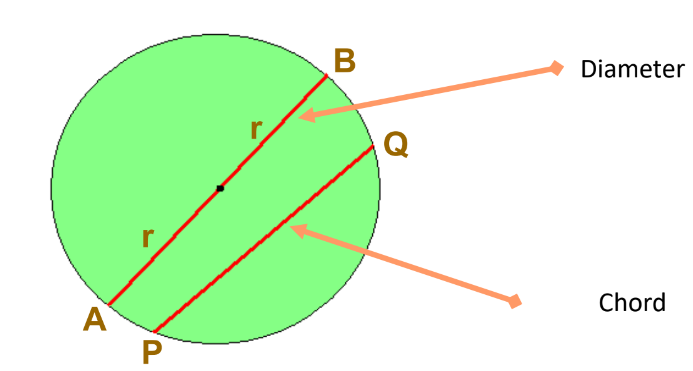
Diameter and Chord

  • Diameter: The longest chord of a circle, equal to two times the radius.
  • Chord: A line segment with both endpoints on the circle.

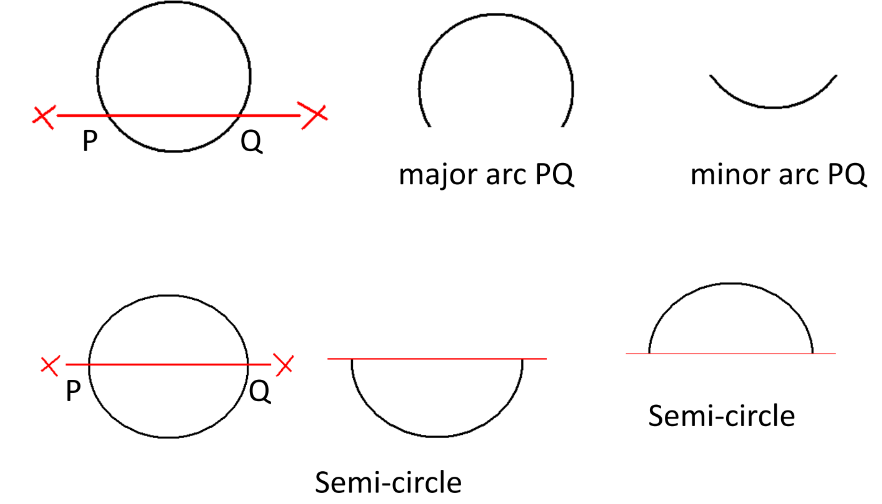
Arcs

image 291
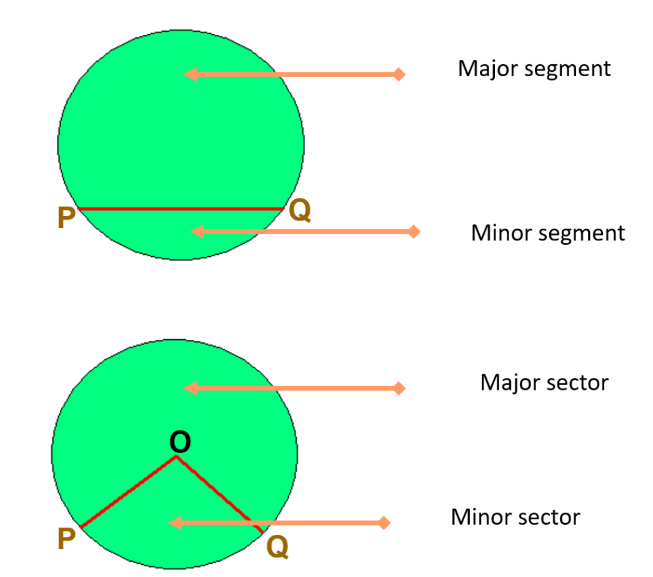
  • Major Arc and Minor Arc: Different segments of a circle.
  • Semi-circle: Half of a circle.

Circumference

image 295

The length of the complete circle.

More Related Terms:

image 288

Angles Subtended by Chords

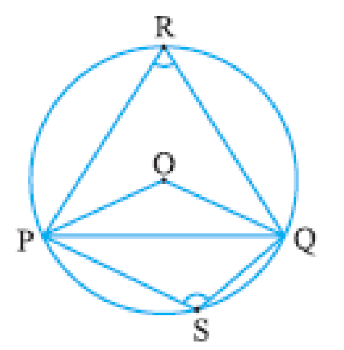
image 299
  • Angles subtended by chord PQ at the center is ∠POQ.
  • Angles subtended by chord PQ at the major arc is ∠PRQ.
  • Angles subtended by chord PQ on the minor arc is ∠PSQ.

Theorems

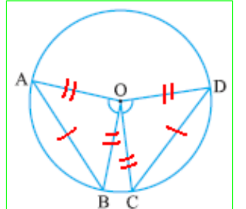
  1. Equal Chords Subtend Equal Angles:
image 286

Given: AB = CD 

To Prove: ∠AOB = ∠COD

Proof: In triangle AOB and COD

OA = OC (radii)

OB = OD (radii)

AB = CD (given)

⧍AOB ≅ ⧍COD (SSS)

         ∠AOB = ∠COD   (CPCT)

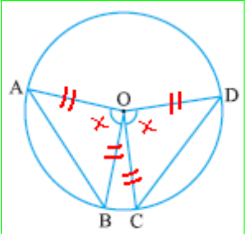
  1. If the angles subtended by the chords at the center are equal, then the chords are equal:
image 297

Given: ∠AOB = ∠COD

Prove: AB = CD

Proof: In triangle AOB and COD

OA = OC (radii)

OB = OD (radii)

 ∠AOB = ∠COD (given)

⧍AOB ≅ ⧍COD (SAS)

         AB = CD   (CPCT)

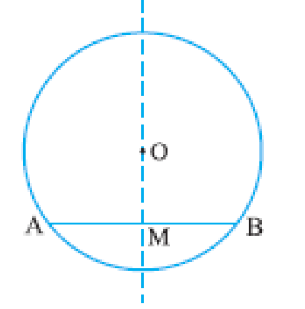
Perpendicular from the Centre to a Chord

image 287

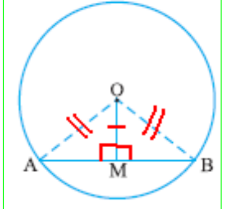
AB is the chord.

OM is the perpendicular from the center of the circle to the chord AB.

  1. The perpendicular from the center of a circle to a chord bisects the chord.
image 289

Given: OM ⊥ AB

Prove: AM = BM

Proof:  In triangles OMA and OMB

OA = OB (radii)

OM = OM (common)

∠OMA = ∠OMB = 90⁰ (given)

⧍AOM ≅ ⧍BOM (RHS)

  AM = BM   (CPCT)

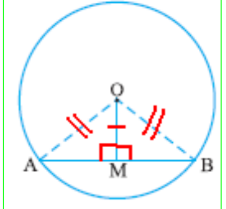
  1. The line drawn through the center of a circle to bisect a chord is perpendicular to the chord:
image 292

Given: AM = BM

Prove: OM ⊥ AB

Proof: In triangles OMA and OMB.

OA = OB (radii)

OM = OM (common)

AM = BM (given)

⧍AOM ≅ ⧍BOM (SSS)

 ∠OMA = ∠OMB = 90⁰  (CPCT)

Circles Through Points

  • Infinite circles can pass through one or two points.
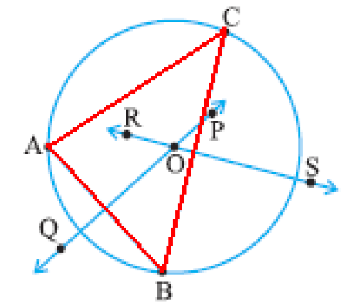
  • Only one circle can pass through three non-collinear points.
  • There is one and only one circle passing through three given non-collinear points.

If ABC is a triangle.

image 290

• Then the circle (above) is called the circumcircle.

• Centre of the circle is called the circumcentre.

• Radius of the circle is called circumradius.

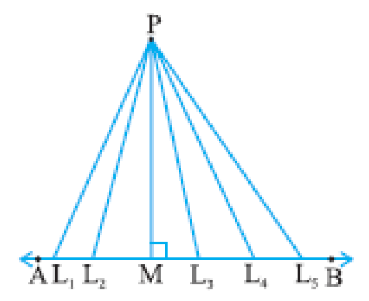
Equal Chords and Distances from Centre

image 293

The length of the perpendicular from a point to a line is the distance of the line from the point.

In the figure above, PM is the distance of the line AB from the point.

Equal Chords and Distances

  • Theorem: Equal chords are equidistant from the center.
  • Theorem: Chords equidistant from the center are equal.

Angles Subtended by Arcs

  • Theorem: Equal chords have congruent arcs and subtend equal angles at the center.
  • Theorem: The angle subtended by an arc at the center is double the angle subtended at any other point.

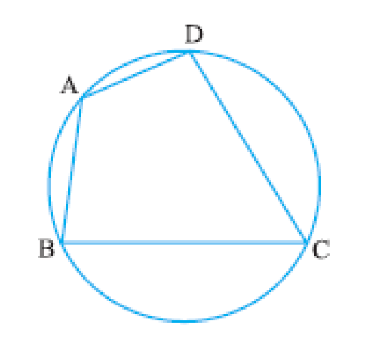
Cyclic Quadrilaterals

  • Definition: A quadrilateral with all vertices on a circle.
image 298
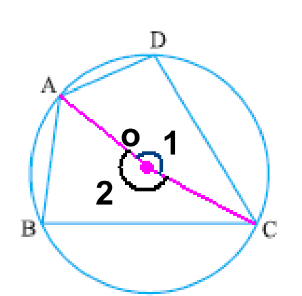
  • Theorem: The sum of either pair of opposite angles of a cyclic quadrilateral is 180⁰.
image 300

Draw AO & OC and name the angles as  ∠1 and  ∠2 as shown in the figure.

 ∠1 = 2  ∠ABC

 ∠2 = 2  ∠ADC

 ∠1 +  ∠2 = 2 ( ∠ABC +  ∠ADC)

But,  ∠1 +  ∠2 = 360⁰

2 ( ∠ABC +  ∠ADC) = 360⁰

and  ( ∠ABC +  ∠ADC) = 180⁰

By understanding these fundamental properties and theorems, students will gain a comprehensive understanding of circles for chapter,9 class 9, and their geometric significance.

In conclusion, Chapter 9 of Class 9 Mathematics, Circles, offers a deep dive into one of the most fascinating geometric shapes. From understanding the basic definition of a circle to exploring its components like radius, diameter, and chords, to learning essential theorems, this chapter lays a solid foundation in geometry.

The practice of these concepts will enable you to solve complex problems with ease. At iPrep, our resources for Class 9 Math Chapter 9 Circles are tailored to ensure you excel in your studies. Dive into the animated videos, practice exercises, and notes to reinforce your understanding of Circles and boost your performance in exams. Keep revisiting this guide to master the intricacies of Class 9 Chapter 9 Circles, and enjoy learning with iPrep!

Practice questions on Chapter 9 - Circles

Get your free Chapter 9 - Circles practice quiz of 20+ questions & detailed solutions

Practice Now
Math

Chapter 9 - Circles

Learn more about iPrep

Download the App

Watch lectures, practice questions and take tests on the go.

Playing with Constructions – Complete Guide For Class 6 Math Chapter 8

Welcome to iPrep, your Learning Super App. Our learning resources for the chapter, Playing with Constructions in Mathematics for Class 6th are designed to ensure that you grasp this concept with clarity and perfection. Whether you’re studying for an upcoming exam or strengthening your concepts, our engaging animated videos, practice questions and notes offer you the best of integrated learning with interesting explanations and examples. 

The chapter Playing with Constructions introduces students to basic geometric constructions using tools like a ruler, compass, and protractor. It covers fundamental concepts such as drawing accurate line segments, perpendiculars, and angles of various measures. Students learn to construct bisectors of lines and angles, helping them understand symmetry and division of shapes. The chapter emphasizes precision and technique, encouraging students to follow systematic steps for accurate constructions. Through hands-on practice, students develop spatial awareness and problem-solving skills, laying the groundwork for more advanced geometric studies in higher classes.

Playing with Constructions

In the chapter – Playing with Constructions, we will explore the fascinating world of geometry by learning how to use tools like rulers and compasses to create precise and beautiful constructions. 

Artwork

We start the chapter by Playing with constructions by observing some interesting figures and trying to draw them freehand. But to achieve perfect precision, we’ll need to arm ourselves with a ruler and a compass. 

These simple tools will help us explore various shapes and curves, enhancing our understanding of geometry.

Exploring Curves and Circles

According to the chapter, Playing with Constructions, Curves are any shapes that can be drawn on paper with a pencil. They include straight lines, circles, and other figures. 

a visual representation of curves and circles form class 6 math chapter 8 - Playing with constructions

To get started, mark a point ‘P’ in your notebook. Now, imagine marking points in different directions, all at a distance of 4 cm from point P. 

What shape do you think they will form?

a visual representation of angles form class 6 math chapter 8 - Playing with constructions

Using a compass, set the distance between the tip and the pencil to 4 cm. 

Place the tip on point P and draw a full circle by moving only the pencil. 

This circle will have all points exactly 4 cm away from P, which is known as the radius. The point P is the center of the circle.

Squares and Rectangles

Within the chapter playing with constructions, when moving from circles to shapes with straight lines, we explore squares and rectangles—two of the most fundamental shapes in geometry.

  • Understanding Rectangles

Consider a rectangle named ABCD. The points A, B, C, and D are its corners, and the lines AB, BC, CD, and DA are its sides. 

In a rectangle, the opposite sides are equal in length, and all angles are 90°. Lines AB, BC, CD, and DA are its sides. Its angles are ∠A, ∠B, ∠C, and ∠D. The blue sides AB and CD are called opposite sides, as they lie opposite to each other. 

Likewise, AD and BC are the other pair of opposite sides.

a visual representation of squares and rectangles form class 6 math chapter 8 - Playing with constructions
  • Understanding Squares

A square is similar to a rectangle but with all sides equal in length. Like rectangles, all angles in a square are also 90°. 

When naming a square or rectangle, it’s essential to follow the order of the corners as you travel around the shape. 

For exConstructing Rectanglesample, in rectangle ABCD, you can also name it BCDA, CDAB, etc., but not ABDC or ACBD.

Rotated Squares and Rectangles

As stated in the chapter playing with constructions, even when rotated, a square remains a square, and a rectangle remains a rectangle, as the lengths of the sides and the angles do not change.

a visual representation of rotated squares and rectangles form class 6 math chapter 8 - Playing with constructions
image 191

Let us check if the rotated square still satisfies the properties of a square. 

• Are all the sides still equal? Yes. 

• Are all the angles still 90°? Yes. 

Rotating a square does not change its lengths and angles. 

Therefore, this rotated figure satisfies both the properties of a square and so, it is a square. 

By the same reasoning, a rotated rectangle is still a rectangle.

Constructing Squares and Rectangles

Going further in the chapter playing with constructions, now that we understand the properties of squares and rectangles, let’s construct them using a ruler and compass.

  • Constructing a Square

           Steps to construct a square with a side of 6 cm:

  1. Draw a line segment PQ of 6 cm.
  2. Use a compass to draw a perpendicular line from point P.
  3. Mark point S on the perpendicular such that PS is also 6 cm.
  4. Repeat the process from point Q to complete the square.
image 189

You can follow a similar method to construct rectangles. 

For instance, to draw a rectangle with sides of 4 cm and 6 cm, start by drawing a line segment of 6 cm, and then use a compass to draw perpendiculars and complete the rectangle.

An Exploration in Rectangles

In this section of the chapter Playing with Constructions, we delve deeper into the properties of rectangles by exploring the distances between different points on the rectangle.

  • Understanding Positions and Distances

Imagine a rectangle ABCD with AB = 7 cm and BC = 4 cm. Points X and Y can move along sides AD and BC, respectively. 

The distance between X and Y varies depending on their positions. You can experiment by placing X and Y at different distances from A and B and measuring the length of the line XY.

image 200

In each of these cases, observe 

1. how the length of XY compares to that of AB and  

2. the shape of the 4-sided figure ABYX.

The distance between X and Y can be obtained by measuring the length of the line XY. 

Change the positions of X and Y to check if there are other positions where they are at their nearest or farthest. You could construct multiple copies of the rectangle and try out various positions of X and Y. Now let’s explore another topic of the chapter playing with constructions named Breaking Rectangles.

Breaking Rectangles

To add more fun, try breaking a rectangle into smaller squares. 

For instance, can you divide a rectangle into two identical squares? 

image 190

Since, the two squares are identical, AB = BC and FE = ED. 

Since ABEF and BCDE are squares, all the sides in each of the squares are equal. 

This is written as— 

AF = AB = BE = FE 

BE = BC = CD = ED 

So, all the shorter lines are equal!

A convention is followed to represent equal sides. It is done by putting a ‘|’ on the line.

This exercise challenges your understanding of the relationship between the sides of squares and rectangles.

We can construct more figures like

  • A Square within a Rectangle
image 197
  • Falling Squares
image 200
  • Square with a Hole
image 195

Now that we understand the concept of breaking rectangles, let’s go further in the chapter Playing with Constructions for Exploring Diagonals of Rectangles and Squares.

Exploring Diagonals of Rectangles and Squares

Consider a rectangle PQRS. Join PR and QS. These two lines are called the diagonals of the rectangle. 

image 201

Compare the lengths of the diagonals.  

In rectangle PQRS, the right angles at P and R are referred to as opposite angles. The other pair of opposite angles are the right angles at Q and S.

Observe that a diagonal divides each of the pair of opposite angles into two smaller angles. 

In the figure, the diagonal PR divides angle R into two smaller angles which we simply call g and h. The diagonal also divides angle P into c and d.

Now, check that:

  1. Are g and h equal? 
  2. Are c and d equal?

Measure them and identify pairs of angles that are equal.

Example

Construct a rectangle where one of its sides is 5 cm and the length of a diagonal is 7 cm.

Solution:  

Let us start with a rough diagram

Steps of Construction:

  1. The base CD measuring length of 5 cm can be easily constructed.
  2. Draw a perpendicular to line DC at the point C. Let us call this line l 
  3. This is easy as we know that this line is perpendicular to the base. The point B should be somewhere on this line l.
  4. To locate the point B, we can draw an arc on the line l.
  5. Construct perpendiculars to DC and BC passing through D and B, respectively. The point where these lines intersect is the fourth point A.
image 199

Check if ABCD is indeed a rectangle satisfying properties:

  • The opposite sides are equal in length.
  • All the angles are 90°.

Points Equidistant from Two Given Points

Construct House

All the lines forming the border of the house are of length 5 cm.

Solution:

The first task is to identify in what sequence the lines and curve will have to be drawn.

Step 1: We need to locate point A which is of distance 5 cm from points B and C. Y

image 196

Step 2

Draw a curve that has all its points of 5 cm from point B; the circle centered at B should be with a 5 cm radius. 

Point A can be located by finding the correct point on the circle that is a of distance 5 cm from point C. 

Step 3

Point A could have been obtained just by drawing arcs of radius 5 cm from points B and C. 

image 198

Join A to B and A to C in straight lines. 

Having obtained point A, what remains is the construction of the remaining arc. 

Step 4

Take a 5 cm radius in the compass and from A, draw the arc touching B and C as shown in the figure.

image 202

The house is ready!

In conclusion, Math CBSE Class 6th Math, Chapter 8 – Playing with Constructions introduces students to the essential tools and techniques for mastering geometric constructions. By exploring the properties of basic shapes like circles, squares, and rectangles, students build a strong foundation in precision and accuracy. The hands-on activities in Playing with Constructions enable students to develop a deeper understanding of geometry and its applications. iPrep Learning Super App offers a comprehensive learning experience for Math CBSE Class 6th Math, Chapter 8 – Playing with Constructions through engaging animated videos, interactive practice questions, and detailed notes. Whether you’re revising or preparing for an exam, our resources will ensure that you excel in Playing with Constructions and strengthen your overall mathematical skills.

Practice questions on Chapter 8 - Playing with Constructions

Get your free Chapter 8 - Playing with Constructions practice quiz of 20+ questions & detailed solutions

Practice Now
Math

Chapter 8 - Playing with Constructions

Learn more about iPrep

Download the App

Watch lectures, practice questions and take tests on the go.

Perimeter and Area – Complete Guide For Class 6th Math Chapter 6

Welcome to iPrep, your Learning Super App. Our learning resources for the chapter, Perimeter and Area in Mathematics for Class 6th are designed to ensure that you grasp this concept with clarity and perfection. Whether you’re studying for an upcoming exam or strengthening your concepts, our engaging animated videos, practice questions and notes offer you the best of integrated learning with interesting explanations and examples. 

The chapter Perimeter and Area introduces students to the fundamental concepts of measuring the boundaries and enclosed spaces of various shapes. The perimeter is defined as the total length around a figure, such as a rectangle, square, or any polygon, calculated by summing the lengths of all its sides. The area, on the other hand, measures the space within a closed figure and is typically expressed in square units. Through practical examples and activities, students develop a solid understanding of how to apply these concepts to solve real-world problems, laying the groundwork for more advanced geometric studies.

Perimeter and Area

Perimeter

The perimeter of any closed plane figure is the total distance covered along its boundary when you trace around it once. 

For polygons, which are closed plane figures made up of straight line segments, the perimeter is simply the sum of the lengths of all its sides.

Perimeter Formulas for Common Shapes

Perimeter of Rectangle

As stated in the chapter perimeter and area, the perimeter of a rectangle is calculated by adding together the lengths of all four sides. A simpler formula is to double the sum of the rectangle’s length and breadth:

Perimeter of a rectangle = 2 × (length + breadth)

For example, if a rectangle has a length of 12 cm and a breadth of 8 cm, its perimeter would be 40 cm.

an image depicting a rectangle from class 6 math chapter 6 - Perimeter and Area

Perimeter of rectangle = Sum of the lengths of its four sides 

                                            = AB + BC + CD + DA

                                            = AB + BC + AB + BC

                                            = 2 × AB + 2 × BC 

                                            = 2 × (AB + BC) 

                                            = 2 × (12 cm + 8 cm)

                                            = 2 × (20 cm) = 40 cm.

From this example, we see that the perimeter of a rectangle = length + breadth + length + breadth. 

The perimeter of a rectangle = 2 × (length + breadth). 

The perimeter of a rectangle is twice the sum of its length and breadth.

Perimeter of Square

As mentioned in the chapter perimeter and area, Since all four sides of a square are equal, the perimeter is four times the length of one side:

The perimeter of a square = 4 × length of a side

For instance, a square with a side length of 1 meter would have a perimeter of 4 meters.

image 179

The perimeter of the square = sum of the lengths of all four sides of the square 

                                               = 1 m + 1 m + 1 m + 1 m = 4 m. 

Now, we know that all four sides of a square are equal in length. 

Therefore, in place of adding the lengths of each side, we can simply multiply the length of one side by 4. 

Thus, the length of the tape required = 4 × 1 m = 4 m. 

From this example, we see that the Perimeter of a square = 4 × length of a side. 

The perimeter of a square is quadruple the length of its side.

The Perimeter of a Triangle

The chapter perimeter and area also cover The perimeter of a triangle, which is the sum of the lengths of its three sides. 

For example, Consider a triangle having three given sides of lengths 4 cm, 5 cm and 7 cm. Find its perimeter. 

image 182

The perimeter of the triangle = 4 cm + 5 cm + 7 cm = 16 cm. 

The perimeter of a triangle is = sum of the lengths of its three sides

Practical Examples of Common Shapes

Example 1: Akshi wants to put lace around a rectangular tablecloth that is 3 meters long and 2 meters wide. 

Solution: Length of the rectangular table cover = 3 m. 

The breadth of the rectangular table cover = 2 m. 

Akshi wants to put lace all around the tablecloth. 

Therefore, the length of the lace required will be the perimeter of the rectangular tablecloth. 

Now, the perimeter of the rectangular tablecloth = 2 × (length + breadth) = 2 × (3 m + 2 m) = 2 × 5 m = 10 m. 

Hence, the length of the lace required is 10 m.

Example 2: Usha takes three rounds of a square park with each side measuring 75 meters. 

image 183

Solution

Perimeter of the square park = 4 × length of a side = 4 × 75 m = 300 m. Distance covered by Usha in one round = 300 m. 

Therefore, the total distance traveled by Usha in three rounds = 3 × 300 m = 900 m.

Deep Dive Activity

Understanding Perimeters through Real-Life Applications

In races, tracks often share a common finish line. 

Imagine two square tracks: the inner track has sides of 100 meters, while the outer track has sides of 150 meters. 

If the race is 350 meters long, where should the starting positions be to ensure both runners finish at the same point? This type of problem helps students apply perimeter concepts to real-world situations.

Explore and Verify

To better understand perimeter, try this activity: 

Take a piece of paper, cut it into different shapes, and estimate the perimeter. Then, measure the actual perimeter with a scale or tape measure to see how close your estimation was.

Perimeter of Regular Polygons

Regular polygons are closed figures with all sides and angles equal, like equilateral triangles or regular pentagons. 

The perimeter of a regular polygon is the length of one side multiplied by the number of sides.

Perimeter of Equilateral Triangle

We know that for any triangle its perimeter is sum of all three sides.  

Using this understanding, we can find the perimeter of an equilateral triangle. 

image 182

Perimeter of an equilateral triangle = AB + BC + AC 

                                                                    = AB + AB + AB (all sides are equal)

                                                                   = 3 times length of one side.

Perimeter of an equilateral triangle = 3 × length of a side

Understanding Area

The chapter perimeter and area covers a deep understanding of the concept of Area. This involves-

Area

The area of a closed figure is the amount of region enclosed within its boundaries. This concept was introduced in earlier grades using square grid paper.

Area of a Rectangle

Area = length × width

Area of a Square

Area = side length × side length

Example 1: A floor is 5 m long and 4 m wide. A square carpet of sides 3 m is laid on the floor. Find the area of the floor that is not carpeted.

Solution

Length of the floor = 5 m. 

Width of the floor = 4 m. 

Area of the floor = length × width = 5 m × 4 m = 20 sq m. 

Length of the square carpet = 3 m. 

Area of the carpet = length × length = 3 m × 3 m = 9 sq m. 

Hence, the area of the floor laid with carpet is 9 sq m. 

Area of the floor that is not carpeted is =  area of the floor – the area of the floor laid with carpet 

             = 20 sq m – 9 sq m 

             = 11 sq m.

Example 2: Four square flower beds each of side 4 m are in four corners on a piece of land 12 m long and 10 m wide. Find the area of the remaining part of the land.  

Solution

Length of the land (l) = 12 m. 

Width of land (w) = 10 m. 

Area of the whole land = l × w = 12 m × 10 m = 120 sq m. 

The sidelength of each of the four square flower beds is (s) = 4 m. 

Area of one flower bed = s × s = 4 m × 4 m = 16 sq m. 

Hence, the area of the four flower beds = 4 × 16 sq m = 64 sq m. 

Area of the remaining part of the land = area of the complete land – the area of all four flower beds 

                             = 120 sq m – 64 sq m 

                             = 56 sq m.

Estimating Area Using Graph Paper

The chapter perimeter and area also covers estimating area using graph paper. You can estimate the area of any simple closed shape using graph paper by counting the full squares and appropriately accounting for partial squares.

Look at the figures below and guess which one of them has a larger area.

image 184

We can estimate the area of any simple closed shape by using a sheet of squared paper or graph paper where every square measures 1 unit × 1 unit or 1 square unit. 

To estimate the area, we can trace the shape onto a piece of transparent paper and place the same on a piece of squared or graph paper and then follow the below conventions— 

1. The area of one full small square of the squared or graph paper is taken as 1 sq unit. 

2. Ignore portions of the area that are less than half a square. 

3. If more than half of a square is in a region, just count it as 1 sq unit. 

Area of a Triangle

The chapter Perimeter and area covers the area of a triangle. It includes-

Understanding Triangle Area

Activity: Cut a rectangle along its diagonal to form two triangles. 

Notice that these triangles have the same area, indicating that the area of each triangle is half the area of the rectangle.

image 181

Formula: Area of a Triangle: For any triangle formed by drawing a diagonal in a rectangle, the area of the triangle is half the area of the rectangle.

Find the Area of triangle ABE?

Solution

The  area of triangle BAD is half of the area of the rectangle ABCD.

Area of triangle ABE = Area of triangle AEF + Area of triangle BEF.

 Here, the area of triangle AEF = half of the area of rectangle AFED. 

Similarly, the area of triangle BEF = half of the area of rectangle BFEC. 

Thus, the area of triangle ABE = half of the area of rectangle AFED +half of the area of rectangle BFEC.

= half of the sum of the areas of the rectangles AFED and BFEC 

= half of the area of the rectangle ABCD.  

Perimeter and Area Relationship

Perimeter: The sum of all the sides of a polygon.

Area: The measure of the enclosed space.

Key Insight: Two shapes can have the same area but different perimeters, or the same perimeter but different areas.

Let’s Conclude

In summary, CBSE Class 6th Math, Chapter 6 – Perimeter and Area equips students with essential skills to measure and understand both the boundaries and the spaces within various shapes. The chapter on Perimeter and Area provides clear explanations of how to calculate the perimeter of rectangles, squares, and triangles, alongside real-life applications and practical examples. Similarly, the section on Area delves into methods for finding the area of rectangles, squares, and triangles, enhancing students’ ability to apply these concepts in everyday situations.

Through engaging activities, such as estimating perimeter and areas with graph paper and practical problems like measuring lace around a tablecloth or calculating distances in a park, students gain a comprehensive grasp of the concepts. The relationship between perimeter and area further reinforces the understanding that while two shapes can share the same area, their perimeters might differ, and vice versa. By mastering these principles, students are well-prepared for more advanced mathematical concepts and applications.

The chapter Perimeter and Area is a foundational element of geometry that helps bridge the gap between basic and more complex geometric studies. Remember, the chapter Perimeter and Area not only builds mathematical skills but also encourages students to appreciate the practical uses of geometry in the real world.

Practice questions on Chapter 6 - Perimeter And Area

Get your free Chapter 6 - Perimeter And Area practice quiz of 20+ questions & detailed solutions

Practice Now
Math

Chapter 6 - Perimeter And Area

Learn more about iPrep

Download the App

Watch lectures, practice questions and take tests on the go.

Human Resources – Complete Guide For Class 8 Geography Chapter 5

Welcome to iPrep, your Learning Super App. Our learning resources for the chapter, “Human Resources” in Geography for Class 8th are designed to ensure that you grasp this concept with clarity and perfection. Whether you’re studying for an upcoming exam or strengthening your concepts, our engaging animated videos, practice questions and notes offer you the best of integrated learning with interesting explanations and examples. 

The chapter ‘Human Resources’ in the Class 8 Geography NCERT book provides a comprehensive overview of the importance and dynamics of human resources. The chapter delves into the distribution, density, and factors influencing population patterns. By examining population change, its patterns, and composition, students gain a nuanced understanding of human resources and their crucial role in shaping societies. Understanding these elements is vital for grasping how populations interact with their environments and the implications for development.

Objectives of the Chapter

Now that we understand the importance of studying this chapter, let’s explore the objectives behind the chapter ‘Human Resources’.

  • To understand how and why populations are spread unevenly across different regions and countries, influenced by geographical and socio-economic factors.
  • To learn about the concept of population density, including how to measure it and the factors that contribute to variations in density across different areas.
  • To identify and analyze the physical and human factors that influence the distribution of populations, such as climate, resources, economic opportunities, and historical events.
  • To explore the dynamics of population change, including birth rates, death rates, and migration patterns, and understand how these factors affect the overall size and structure of populations.
  • To examine historical and current trends in population growth and decline, and recognize patterns such as rapid growth in certain regions and aging populations in others.
  • To analyze the demographic characteristics of populations, including age, sex, and occupation, and understand how these characteristics impact social and economic structures.

Let’s now understand the various sections of the chapter in detail.

First of all, to understand the distribution of population, let’s delve into the section “Distribution of Population” in the chapter “Human Resources.”

Distribution of Population

  • This section explores how populations are spread across different regions, influenced by various geographical, economic, and social factors. 
  • By examining patterns of population distribution, students gain insight into why some areas are densely populated while others are sparsely inhabited. 
  • Understanding these patterns is crucial for grasping the complexities of human geography and the factors that shape our global population landscape.
a graphical representation of the world's most populated countries from class 8 geography chapter 5 - Human Resources

Now, to understand the Density of Population, let us delve into the section Density of Population of the chapter Human Resources

Density of Population

  • This section examines how population density is measured and varies across different regions. 
  • It highlights the number of people living per unit area and explores the implications of high or low density on resources, infrastructure, and living conditions. 
  • Understanding population density is essential for analyzing demographic trends and planning for sustainable development in various parts of the world.
a visual representation of density of population from class 8 geography chapter 5 - human resources

Now, to understand the Factors Affecting the Distribution of Population, let us delve into the section Factors Affecting Distribution of Population of the chapter Human Resources

Factors Affecting The Distribution of Population

  • This section explores the various elements that influence how and why populations are spread across different regions. 
  • Key factors such as climate, topography, economic opportunities, and historical developments shape population distribution. 
  • By examining these factors, we gain insight into patterns of human settlement and the reasons behind varying population densities around the world.
a visual representation of Factors Affecting Distribution of Population from class 8 geography chapter 5 - human resources

The section ‘Factors Affecting Distribution of Population’ covers certain key points. Lets discuss them below.

Geographical Factors

  1. Topography:
    • Plains are preferred for settlement due to their suitability for farming, manufacturing, and service activities.
    • The Ganga plains are among the most densely populated areas globally, while mountains like the Andes, Alps, and Himalayas are sparsely populated.
  2. Climate:
    • Extreme climates (very hot or very cold) are generally avoided.
    • Regions like the Sahara Desert, and polar areas of Russia, Canada, and Antarctica have sparse populations.
  3. Soil:
    • Fertile soils support agriculture and attract dense populations.
    • Examples: Ganga and Brahmaputra plains in India, Hwang-He and Chang Jiang in China, and the Nile in Egypt.
  4. Water:
    • Access to fresh water is a major factor for dense settlements.
    • River valleys are densely populated, while deserts have sparse populations.
  5. Minerals:
    • Areas with mineral deposits attract populations.
    • Examples: Diamond mines in South Africa, oil deposits in the Middle East.
a visual representation of geographical Factors Affecting Distribution of Population from class 8 geography chapter 5 - human resources

Social, Cultural, and Economic Factors

  1. Social:
    • Areas with better housing, education, and healthcare are more densely populated.
    • Example: Pune.
  2. Cultural:
    • Places with religious or cultural significance attract people.
    • Examples: Varanasi, Jerusalem, Vatican City.
  3. Economic:
    • Industrial areas offer employment opportunities and attract large populations.
    • Examples: Osaka in Japan, and Mumbai in India.

Now, to understand the Population Change, let us delve into the section Population Change of the chapter Human Resources

Population Change

  • This section examines the dynamics of how populations evolve over time due to factors such as birth rates, death rates, and migration. 
  • It provides an understanding of how and why population sizes fluctuate and the implications of these changes on societies and economies. 
  • Studying population change helps in grasping the broader impacts on resources, infrastructure, and social service. 
a visual representation of population change from class 8 geography chapter 5 - human resources

The section “Population Change” highlights several important points. Let’s discuss them below.

  1. Definition of Population Change

Population change refers to the variation in the number of people over a specific period. This change is primarily influenced by the number of births and deaths within that time frame.

  1. Historical Population Growth

Historically, population growth was slow and steady until the 1800s, mainly due to high infant mortality rates and inadequate health facilities and food supplies. In 1804, the global population reached one billion. By 1959, it had grown to three billion, a phenomenon often termed the “population explosion.” By 1999, the population had doubled to six billion, driven by improvements in food supply and medical care that lowered death rates while birth rates remained high.

  1. Measurement of Births and Deaths

The measurement of births and deaths is crucial in understanding population dynamics. The birth rate is defined as the number of live births per 1,000 people, while the death rate is the number of deaths per 1,000 people.

  1. Natural Causes of Population Change

Natural causes of population change include the difference between birth rates and death rates, known as the natural growth rate. A rapid increase in the natural growth rate has been a significant factor in the global population rise.

  1. Migration

Migration involves the movement of people into and out of an area. Emigrants are individuals who leave a country, while immigrants are those who arrive in a new country. Countries like the USA and Australia have seen population growth due to immigration, whereas countries like Sudan have experienced population loss due to emigration. International migrations generally flow from less developed nations to more developed ones in search of better employment opportunities. Additionally, within countries, many people move from rural areas to urban centers for jobs, education, and healthcare.

  1. Glossary

Life Expectancy: This term refers to the average number of years a person can expect to live. It is a critical indicator of the overall health and well-being of a population.

a visual representation of balance of Population from class 8 geography chapter 5 - human resources

Now, to understand the Patterns of Population Change, let us delve into the section Patterns of Population Change of the chapter Human Resources

Patterns of Population Change 

  • This section explores the different trends and variations in population growth and decline across regions and periods. 
  • By examining these patterns, we can better understand how demographic shifts affect economic development, urbanization, and resource distribution. 
  • Analyzing these patterns helps in anticipating future demographic challenges and planning for sustainable growth and development.
a visual representation of patterns of Population change from class 8 geography chapter 5 - human resources

Now, to understand the Population Composition, let us delve into the section Population Composition of the chapter Human Resources

Population Composition

  • This section examines the structure of a population in terms of age, sex, occupation, and other demographic characteristics. 
  • Understanding population composition helps in assessing the social and economic needs of a region, as well as planning for healthcare, education, and employment. 
  • This analysis provides insights into the workforce dynamics and the overall well-being of a society.

The section “Population Composition” highlights several important points. Let’s discuss them below.

  1. Economic Development and Population Density

High population density does not always mean economic prosperity. For example, both Bangladesh and Japan are densely populated, but Japan is much more economically developed. This shows that factors like industrialization, education, and infrastructure play a crucial role in economic development beyond just population numbers.

  1. Understanding Population Composition

Population composition involves examining age, sex, literacy, health, occupation, and income levels. This analysis helps understand the human resources available and aids in planning for education, healthcare, and employment to meet the population’s needs effectively.

  1. Significance of Population Composition

Knowing the population composition is essential for identifying demographic characteristics such as age, gender, education, occupation, and income levels. This information is crucial for creating targeted policies and programs to improve overall quality of life.

  1. Population Pyramid (Age-Sex Pyramid)

A population pyramid visually represents a population divided into age groups and further split into males and females. The shape of the pyramid reveals trends in birth rates, death rates, and life expectancy, offering a snapshot of the population’s structure.

a visual representation of Population Pyramid differentiated based on age and sex from class 8 geography chapter 5 - human resources
  1. Interpreting Population Pyramids

Population pyramids help understand demographic characteristics by showing the number of children, adults, and elderly in a population. They indicate whether a population is growing, stable, or declining, and reveal the ratio of dependents to the economically active population.

  1. Examples of Population Pyramids

Kenya’s population pyramid has a broad base and narrows quickly, indicating high birth and death rates. India’s pyramid shows a broad base and steady narrowing, reflecting lower death rates among the young. Japan’s narrow base and wider top show low birth rates and a large elderly population.

a visual representation of Population Pyramid of Kenya from class 8 geography chapter 5 - human resources
  1. Importance of Youth

Young people are a vital resource for any nation. In India, investing in education and skills for the youth can drive economic growth and innovation. A supportive environment for young people ensures a robust and dynamic future workforce.

a visual representation of Population Pyramid Of India from class 8 geography chapter 5 - human resources

Now that we have discussed the whole chapter, let us know the overall learning value of the chapter “Human Resources”. 

Overall Learning Value of the Chapter

The chapter on ‘Human Resources’ is essential for understanding the various dimensions of population dynamics and their impact on society. By studying distribution, density, change, patterns, and composition, students gain valuable insights into how human resources shape and are shaped by their environments. This knowledge is crucial for addressing challenges related to population management and development.

In conclusion, CBSE Class 8th Geography Chapter, “Human Resources,” provides students with a deep understanding of the factors that influence population distribution, density, and composition. It emphasizes the critical role human resources play in shaping societies and economic structures. By exploring topics such as population change, migration, and demographic characteristics, students are equipped with the knowledge to analyze how human resources interact with the environment. Whether you’re preparing for an exam or building a solid foundation in geography, iPrep offers comprehensive resources for mastering the Chapter “Human Resources.” Dive into our engaging videos, detailed notes, and practice questions to strengthen your grasp of the chapter “Human Resources” and succeed in your studies!

Practice questions on Chapter 5 - Human Resources

Get your free Chapter 5 - Human Resources practice quiz of 20+ questions & detailed solutions

Practice Now
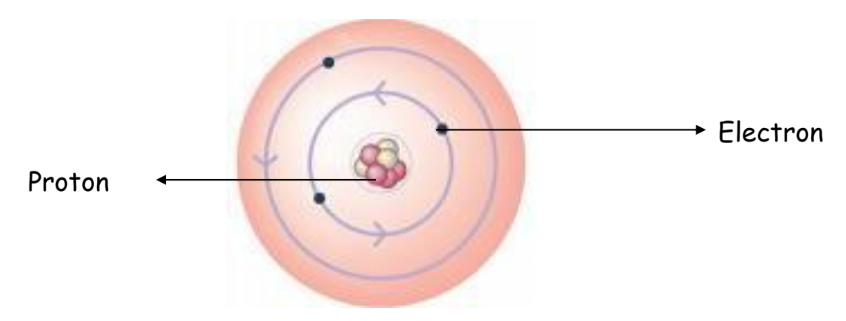
Geography

Chapter 5 - Human Resources

Learn more about iPrep

Download the App

Watch lectures, practice questions and take tests on the go.

Complete Guide For Class 8 History Chapter 2 – From Trade to Territory

Our learning resources for the chapter, “From Trade to Territory: The Company Establishes Power” in History for Class 8th are designed to ensure that you grasp this concept with clarity and perfection. Whether you’re studying for an upcoming exam or strengthening your concepts, our engaging animated videos, practice questions and notes offer you the best of integrated learning with interesting explanations and examples. 

The chapter “From Trade to Territory: The Company Establishes Power,” offers an in-depth exploration of how the British East India Company transitioned from a trading entity to a dominant political power in India. This chapter details the East India Company‘s initial commercial activities, significant military campaigns, and the strategic shifts that led to its control over vast territories. Understanding “From Trade to Territory: The Company Establishes Power” is crucial for grasping the historical impact of British expansion and the transformation of Indian society and economy.

Now that we understand the importance of studying this chapter, let’s explore the objectives behind “From Trade to Territory: The Company Establishes Power.”

From Trade to Territory East India Company Comes East

  • To explore the arrival of the East India Company in the Indian subcontinent and its initial efforts to establish trading rights.
  • To analyze the East India Company‘s negotiations with local rulers to secure trading rights and establish trading posts.
  • To assess the early interactions between the East India Company and local rulers, focusing on trade agreements and diplomatic relations.

The Company’s Expansion and Consolidation

The chapter from Trade to Territory also covers the company’s expansion and consolidation. Here is how:

  • To understand the expansion of the East India Company through key military conflicts such as the Battle of Plassey and the Battle of Buxar.
  • Examine how the East India Company consolidated its power by implementing administrative reforms and controlling revenue collection and governance.

The Impact of British Rule

  • Analyze the socio-economic changes brought about by the East India Company‘s rule, including changes in land revenue systems and agricultural practices.
  • Explore the broader impacts of British control on Indian society, economy, and local customs.

Let’s now understand these objectives in detail.

Objectives Of British Coming To India

Initial Establishment

  • The East India Company arrived in India in the early 17th century with the aim of tapping into the lucrative spice trade. 
  • Its initial goal was to secure trading rights from local rulers and establish trading posts along the Indian coastline. 
  • This set the stage for the Company’s expanding influence in the region.

Formation of Trading Posts

  • The East India Company quickly established trading posts in key coastal cities such as Surat, Madras, and Bombay. 
  • These posts became central hubs for trade and commerce, where the Company conducted its business operations under the granted trading rights. 
  • The establishment of these posts was crucial for the Company’s commercial success.
A visual depicting formation of trade posts from the class 8 history chapter 2 - From Trade To Territory
image 254

Diplomatic Relations

  • To safeguard and enhance its commercial interests, the East India Company fostered diplomatic relations with local rulers. 
  • This strategic move was essential for maintaining and expanding its trading rights. Additionally, the Company began to trade in Bengal, leading to conflicts over trade routes and resources. 
  • These tensions eventually culminated in significant battles such as the Battle of Plassey (1757) and the Battle of Buxar (1764), which marked the consolidation of British power in India. 
image 257
image 260
  • The success of these battles led to Company officials becoming known as “nabobs,” a term reflecting their newly acquired wealth and influence.
image 261

Now, let’s delve into The Company’s Expansion and Consolidation to understand how the East India Company solidified its control and extended its influence throughout the Indian subcontinent.

Company Rule Expands

Military Confrontations

  • The East India Company‘s expansion was marked by significant military confrontations. 
  • Additionally, the East India Company faced notable figures like Tipu Sultan, the “Tiger of Mysore,” in its quest for control. 
image 255
  • The East India Company’s wars with the Marathas also played a critical role in expanding its influence.

Acquisition of Territories

Further in the chapter – From Trade to Territory, we’ll cover the topic of acquisition of territories. It involves:

  • After its military victories, the East India Company expanded its territorial control significantly. 
  • This process involved not only acquiring land but also consolidating political and economic power by the East India Company
  • The claim to paramountcy and the doctrine of lapse were instrumental in facilitating the East India Company‘s expansion by asserting its authority over princely states and territories.
image 258

Administrative Reforms

  • To manage its newly acquired territories effectively, the East India Company introduced various administrative reforms. 
  • This included changes in governance structures and revenue collection practices, which helped in the consolidation of its control over the vast regions under East India Company’s influence.

Now next in the chapter – From Trade To Territory, let’s find out how The Impact of British Rule reshaped Indian society and economy under the East India Company, exploring the profound changes brought about by British policies and governance.

Setting up a New Administration

In the chapter From Trade To Territory, there is a significant mention of setting up a new administration. It covers:

Establishment of Control Mechanisms

  • As the East India Company‘s influence expanded, it implemented a new administrative framework to effectively govern its territories. 
  • This involved the creation of a structured system that included the establishment of the Company army for maintaining order, as well as setting up the Presidencies—Calcutta, Madras, and Bombay—as administrative centers. 
  • The framework also incorporated legal institutions like the faujdari adalat for criminal justice and the diwani adalat for revenue and civil matters.
image 256

Revenue Collection Systems

  • A key reform introduced by the East India Company was the overhaul of the revenue collection system. 
  • This new revenue system streamlined tax collection, making it more efficient and reliable. 
  • The East India Company established mechanisms to ensure a steady flow of revenue, which was crucial for supporting its expanding operations and administrative needs.

Impact on Local Governance

  • The imposition of British administrative practices brought significant changes to local governance
  • Traditional systems were either replaced or adapted to fit the new administrative structure set up by the East India Company
  • This shift to local governance led to a profound transformation in how local affairs were managed, with new institutions such as the faujdari adalat and diwani adalat taking over key roles in justice and administration.

This chapter provides an insightful look into how the East India Company transitioned from a trading entity to a powerful colonial ruler, detailing its efforts to secure trading rights, expand its territory, and establish a new administrative system in India.

In conclusion, the chapter “From Trade to Territory: The Company Establishes Power” provides a comprehensive overview of the East India Company’s journey from a commercial enterprise to a dominant colonial authority in India. By exploring the key events and strategic maneuvers that facilitated this transformation, the chapter offers invaluable insights into the profound impact of British expansion on the Indian subcontinent.

From the initial establishment of trading posts to the significant military campaigns and administrative reforms, the chapter vividly illustrates how the East India Company secured its foothold and expanded its control. Understanding “From Trade to Territory: The Company Establishes Power” is essential for grasping the broader historical context of British rule in India and its lasting effects on Indian society and governance.

Our learning resources aim to enhance your understanding of this pivotal chapter, ensuring that you not only master the key concepts but also appreciate the historical significance of the East India Company’s rise to power. By engaging with our animated videos, practice questions, and detailed notes, you can deepen your comprehension and better prepare for your exams.

With a detailed exploration of “From Trade to Territory: The Company Establishes Power,” you are well-equipped to appreciate the complexities of British colonialism and its impact on India’s historical trajectory.

Practice questions on Chapter 2 - From Trade to Territory

Get your free Chapter 2 - From Trade to Territory practice quiz of 20+ questions & detailed solutions

Practice Now
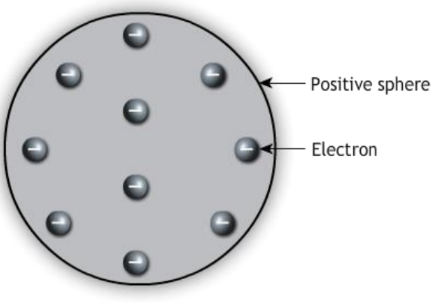
History

Chapter 2 - From Trade to Territory

Learn more about iPrep

Download the App

Watch lectures, practice questions and take tests on the go.