Statistics – Complete Guide For Class 11 Math Chapter 13
Our learning resources for Mathematics Class 11 ‘Statistics’ chapter 13 are designed to ensure that you grasp this concept with clarity and perfection. Whether you’re studying for an upcoming exam or strengthening your concepts, our engaging animated videos, practice questions, and notes offer you the best of integrated learning with interesting explanations and examples.
Our comprehensive approach ensures that you have access to everything you need to have an in-depth understanding of the chapter Statistics. From detailed notes to interactive exercises, our materials are tailored to meet your learning needs and help you excel in your studies. Get ready to dive into an enriching educational experience that will make mastering this chapter a breeze.
What is Statistics?
Statistics involves the collection, organization, analysis, and interpretation of data. In Chapter 13 of Class 11 Mathematics, students explore various statistical measures, including central tendency and dispersion. The chapter covers key concepts such as range, mean deviation, variance, and standard deviation, providing insight into how data is spread around a central value. The significance of dispersion and variability in datasets is highlighted, along with methods to compute deviations for grouped and ungrouped data. Through practical examples, students develop the skills to interpret statistical data effectively.
Consider the following three series and observe the similarities and dissimilarities:
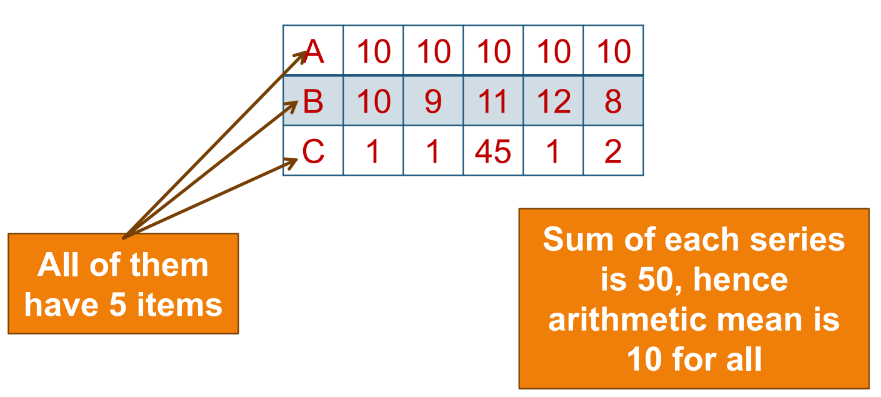
Each series sums to 50, and their arithmetic mean is 10. However, there’s more to analyze:
- Series A: The items coincide exactly with the arithmetic mean.
- Series B: The items show slight deviations from the arithmetic mean.
- Series C: The items exhibit large deviations.
Thus, while the arithmetic mean is 10 for all series, it does not adequately represent all series.
Need for Measures of Dispersion
Measures of central tendency, like the mean, give an incomplete idea of the distribution of items. To gain insights into the variability or scatter of items, we use measures of dispersion.
A measure of dispersion reflects how items are scattered around a fixed value (such as the mean or median).
Measures of Dispersion
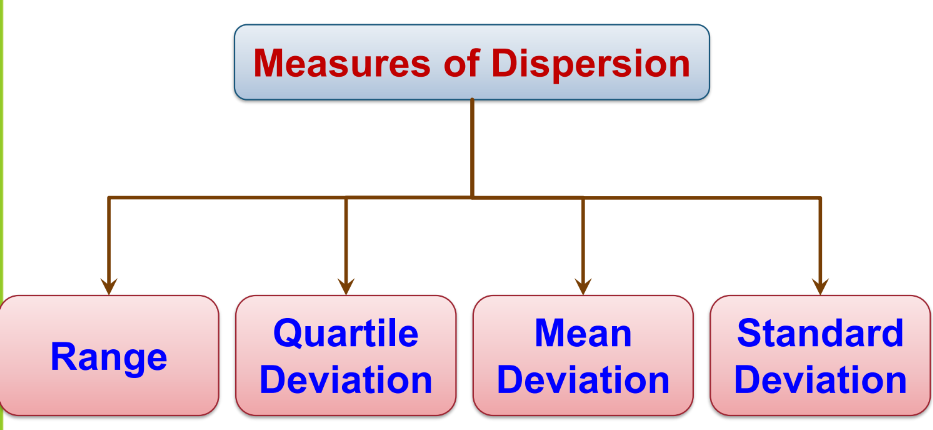
These measures help us understand the spread of data around the central tendency.
Range
The range provides a simple idea of the variability in a series. It is calculated as:
Range = Maximum Value − Minimum Value
Example:
Find the range of the following series:
Series A: 10, 9, 11, 12, 6
Series B: 1, 1, 40, 1, 2
Solution:
- Range of A: 12 − 6 = 6
- Range of B: 40 − 1 = 39
Since Range of B > Range of A, Series B has more scattered data.
Mean Deviation
The mean deviation is the arithmetic mean of the absolute deviations of data from a fixed value (mean or median). Let’s explore this for ungrouped and grouped data.
Mean Deviation for Ungrouped Data
For data values x₁, x₂ ,x₃ ,…, xₙ, the mean deviation from a fixed value ‘a’ is:
M.D.(a) = ∑ ∣xi−a∣/n
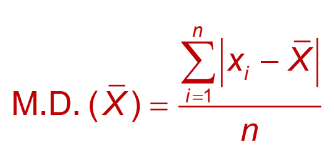
Mean Deviation About the Mean:
M.D.(X) = ∑ ∣xi−X∣/n, Where X is the mean of the data.
Example:
Find the mean deviation about the mean for the following data:
38, 70, 48, 40, 42, 55, 63, 46, 54, 44.
Solution:
- Calculate the mean:
X = 38 + 70 + 48 + 40 + 42 + 55 + 63 + 46 + 54 + 44/10 = 500/10 - Calculate the deviations from the mean and their absolute values:
- Deviations: -12, 20, -2, -10, -8, 5, 13, -4, 4, -6
- Absolute deviations: 12, 20, 2, 10, 8, 5, 13, 4, 4, 6
- Calculate the mean deviation:
M.D.(X) = 12 + 20 + 2 + 10 + 8 + 5 + 13 + 4 + 4 + 6/10 = 8.4
Mean Deviation for Grouped Data
Grouped data can be classified into:
- Discrete Frequency Distribution
- Continuous Frequency Distribution
For both types, the mean deviation can be calculated as:
M.D.(X) = ∑fi ∣xi−X∣/ N, where fi is the frequency and xi is the value of the variable.


Continuous Frequency Distribution
Mean deviation about a mean:
Suppose we have some grouped data which is being divided into n (say) classes. Let x1, x2, x3, …, xn are the class marks of each class. Frequencies of these classes are given by f1, f2, f3, …, fn. Then,
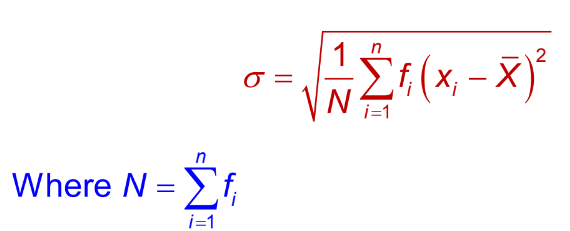
Mean deviation about median
Suppose we have some grouped data which is being divided into n (say) classes. Let x1, x2, x3, …, xn are the class marks of each class. Frequencies of these classes are given by f1, f2, f3, …, fn. Then,

Variance and Standard Deviation
Variance measures the average of squared deviations from the mean:
Standard deviation is the square root of the variance:
The proper measure of dispersion about the mean of a set of observations is expressed as the positive square root of the variance and is called standard deviation.
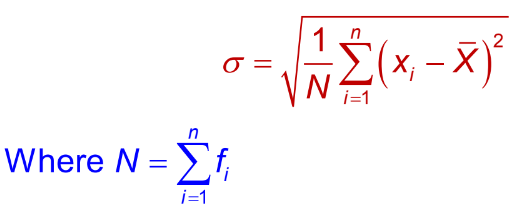
Standard deviation of a discrete frequency distribution
Let f1, f2, ….fn, be the respective frequencies for the values x1, x2, ….,xn of the variable. The standard deviation of the observations is given by:
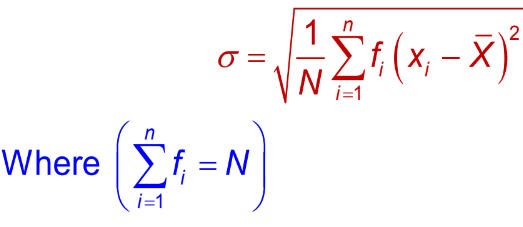
Standard deviation of a continuous frequency distribution:
Suppose we have some grouped data which is being divided into n (say) classes. Let x1
, x2, x3, …, xn are the class marks of each class. Frequencies of these classes are given by f1
, f2, f3, …, fn. Then, the standard deviation of these observations is given by:

Example:
Find the variance and standard deviation for the following data:

Solution:
- Calculate the mean:
X = ∑fixi/∑fi = 760/40 =19
- Compute deviations from the mean, their squares, and the product with frequencies:
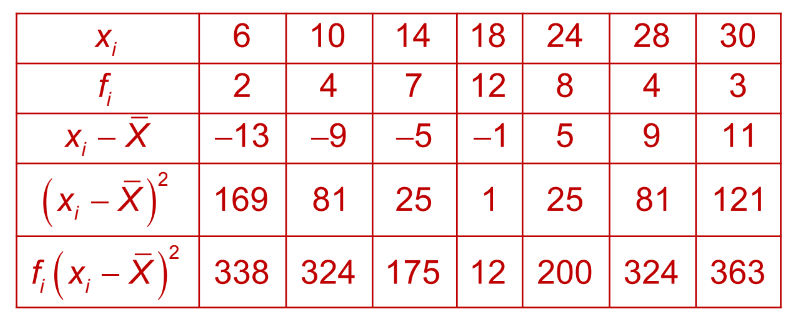
From the above table, we have,
Variance:
σ² = ∑fi(xi−X)²/∑fi = 1736/40 = 43.4
- Standard deviation:
σ = √43.4 ≈ 6.59 ≈ 7
Coefficient of Variation
The measure of variability which is independent of units is called the coefficient of variation (denoted as C.V.).
The coefficient of variation is defined as
C.V. = (σ/X) x 100 given X ≠ 100
Where X and are the mean and standard deviation of the data.
Conclusion
In conclusion, mastering CBSE Class 11 Math Chapter 13 – Statistics is essential for a comprehensive understanding of data analysis. This chapter not only introduces you to key concepts like central tendency but also emphasizes the importance of measures of dispersion, including range, mean deviation, variance, and standard deviation. By exploring these statistical tools, you will gain deeper insights into how data behaves and varies, enhancing your ability to interpret and analyze information effectively. With our engaging resources, you are well-equipped to excel in your understanding of Statistics. Dive into the Statistics chapter and unlock the full potential of your mathematical skills!
Practice questions on Chapter 13 - Statistics
Get your free Chapter 13 - Statistics practice quiz of 20+ questions & detailed solutions
Practice Now


